ABEM Terrameter LS Toolbox
31
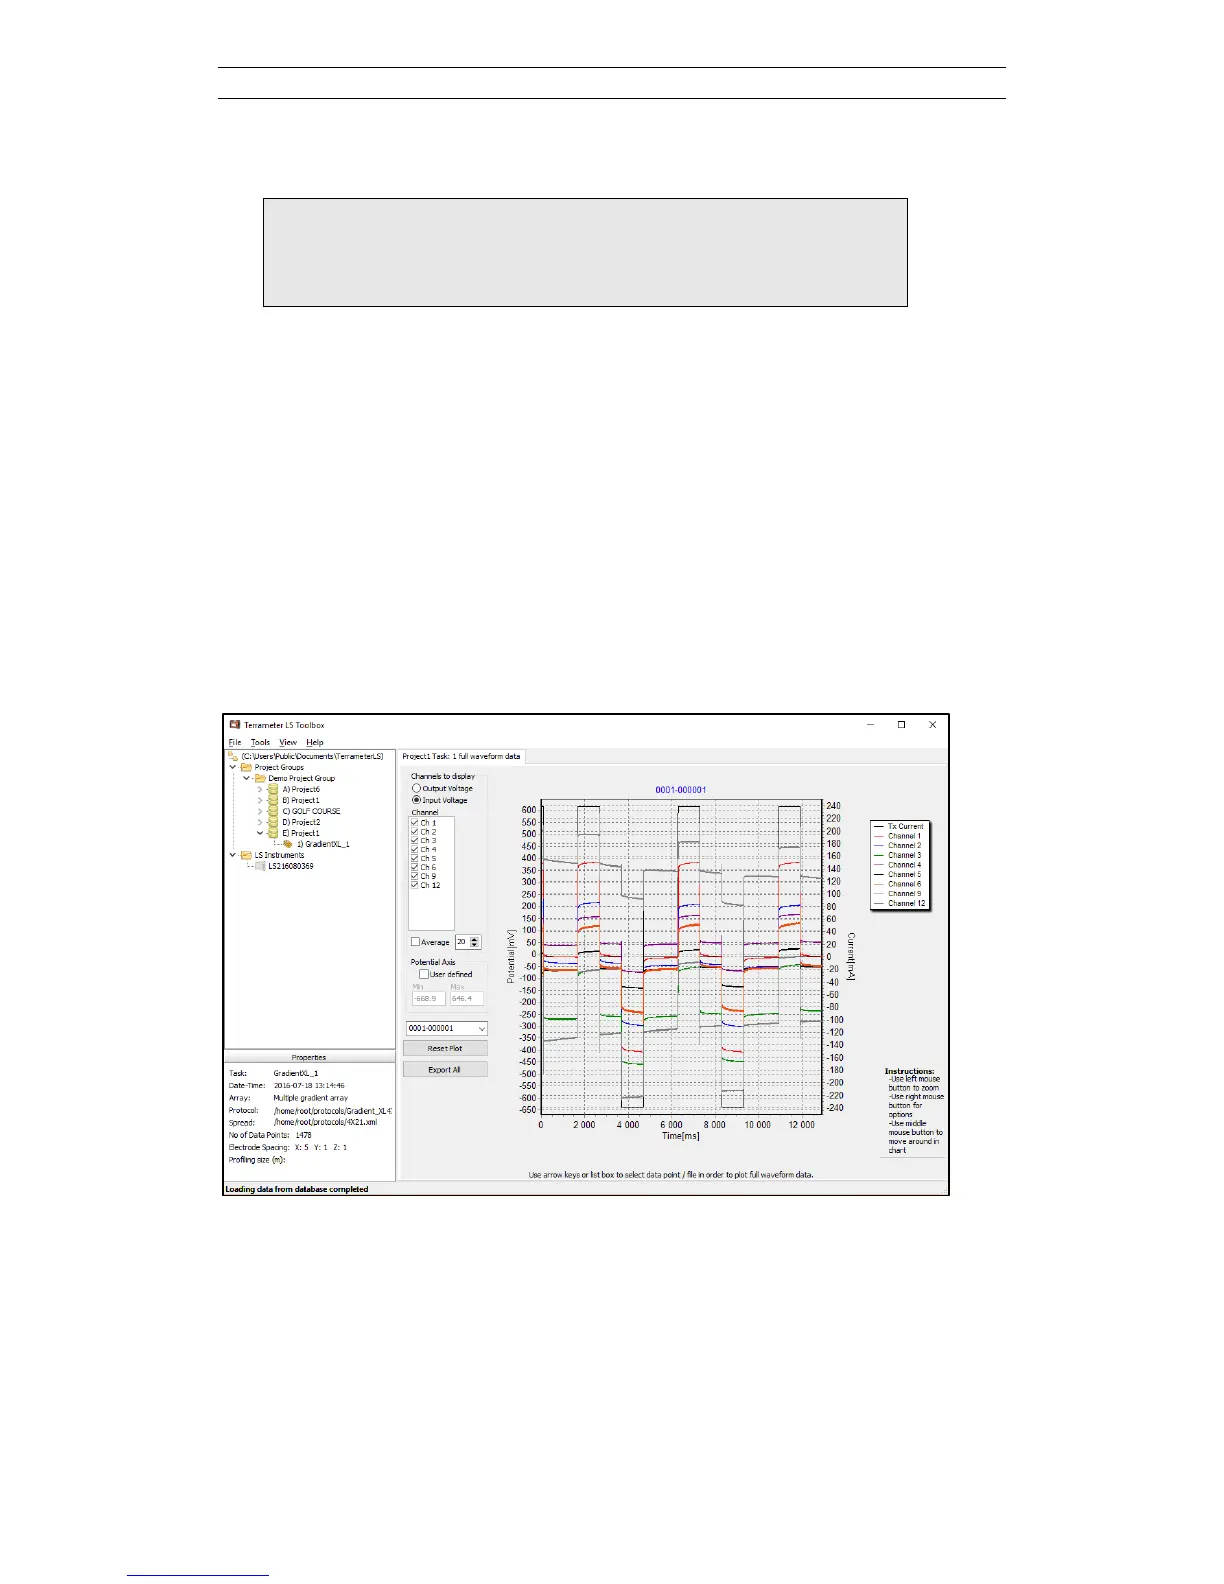
5.2.6 Full Waveform
Note! Full waveform recordings of the data can only be plotted
if the option for saving such data was enabled during the
field data acquisition, and that the data was imported
from the Terrameter LS.
The Full Waveform page (Figure 44) is opened either by right-clicking on the tree
node of the task and selecting Full Waveform from the context menu or by right-
clicking in the Data Table list (see chapter 5.2.1). In the latter case only the first
selected data point or measurement is shown.
By default the diagram shows the transmitted current (black line) and the active input
channels (curves in different colours), as shown in the legend on the right side of the
diagram. It is possible to go to a particular measurement number via the combo box in
the lower left side of the diagram, and it is possible to step up and down between the
measurements of the task using the up and down arrows when the combo box has the
focus.
If several measurement channels were used it may sometimes be useful to turn off
plotting for one or several of the measuring channels to improve the clarity of the plot.
Figure 44. Full waveform plot showing transmitted current and received voltages for
the active input channels.