ABEM Terrameter LS Toolbox
33
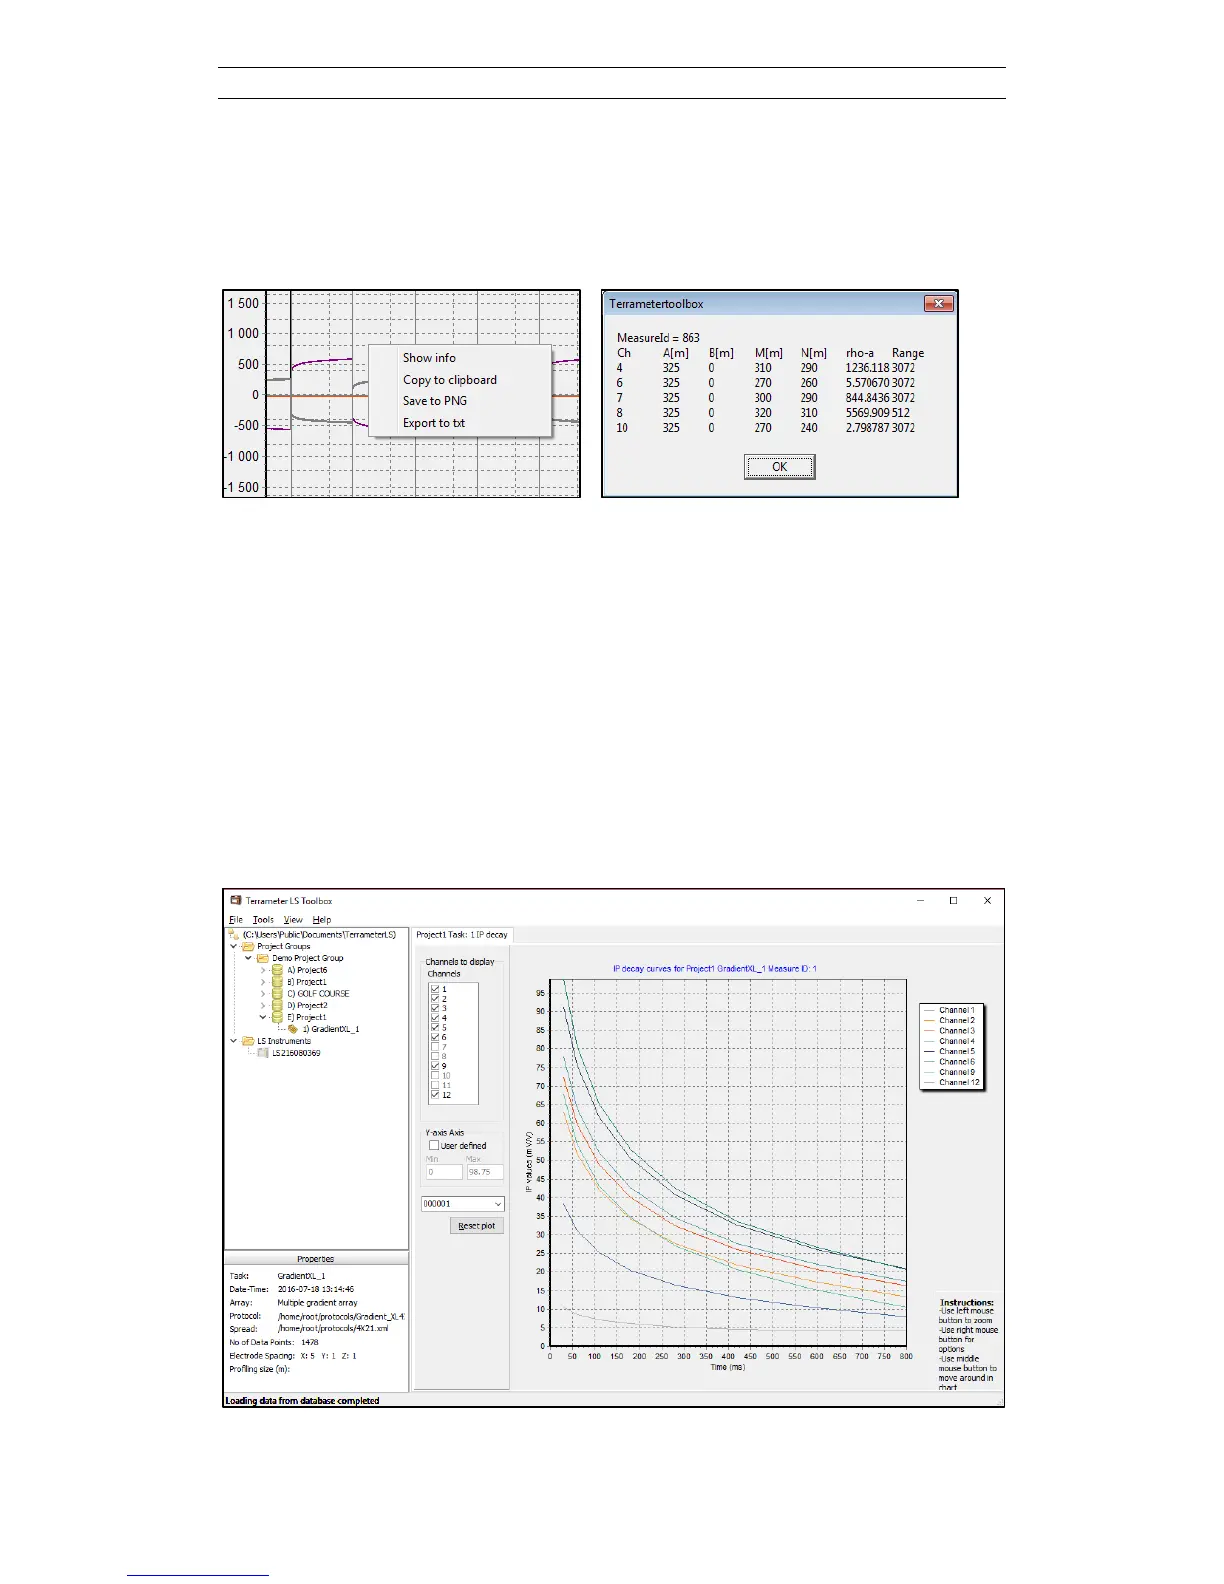
By right clicking on the diagram a summary of the electrode geometry can be shown
with the Show Info menu item (Figure 47). This is also the way to access export of the
diagram to the clipboard or as graphic file, and to export the full waveform data as a
text file.
Figure 47. Electrode geometry information accessed via right click on full waveform
diagram and clicking the Show Info menu item
5.2.7 View IP Decay Curves
The IP Decay Curves page (Figure 48) is opened either by right-clicking on the tree
node of the task and selecting View IP Decay Curves from the context menu or by
right-clicking in the Data Table list. In the latter case only the first selected data point
is shown. It is possible to go to a particular measurement number via the combo box
in the lower left side of the diagram, and it is possible to step up and down between
the measurements of the task using the up and down arrows when the combo box has
the focus.
Figure 48. IP decay curves.