2-132 S Curve
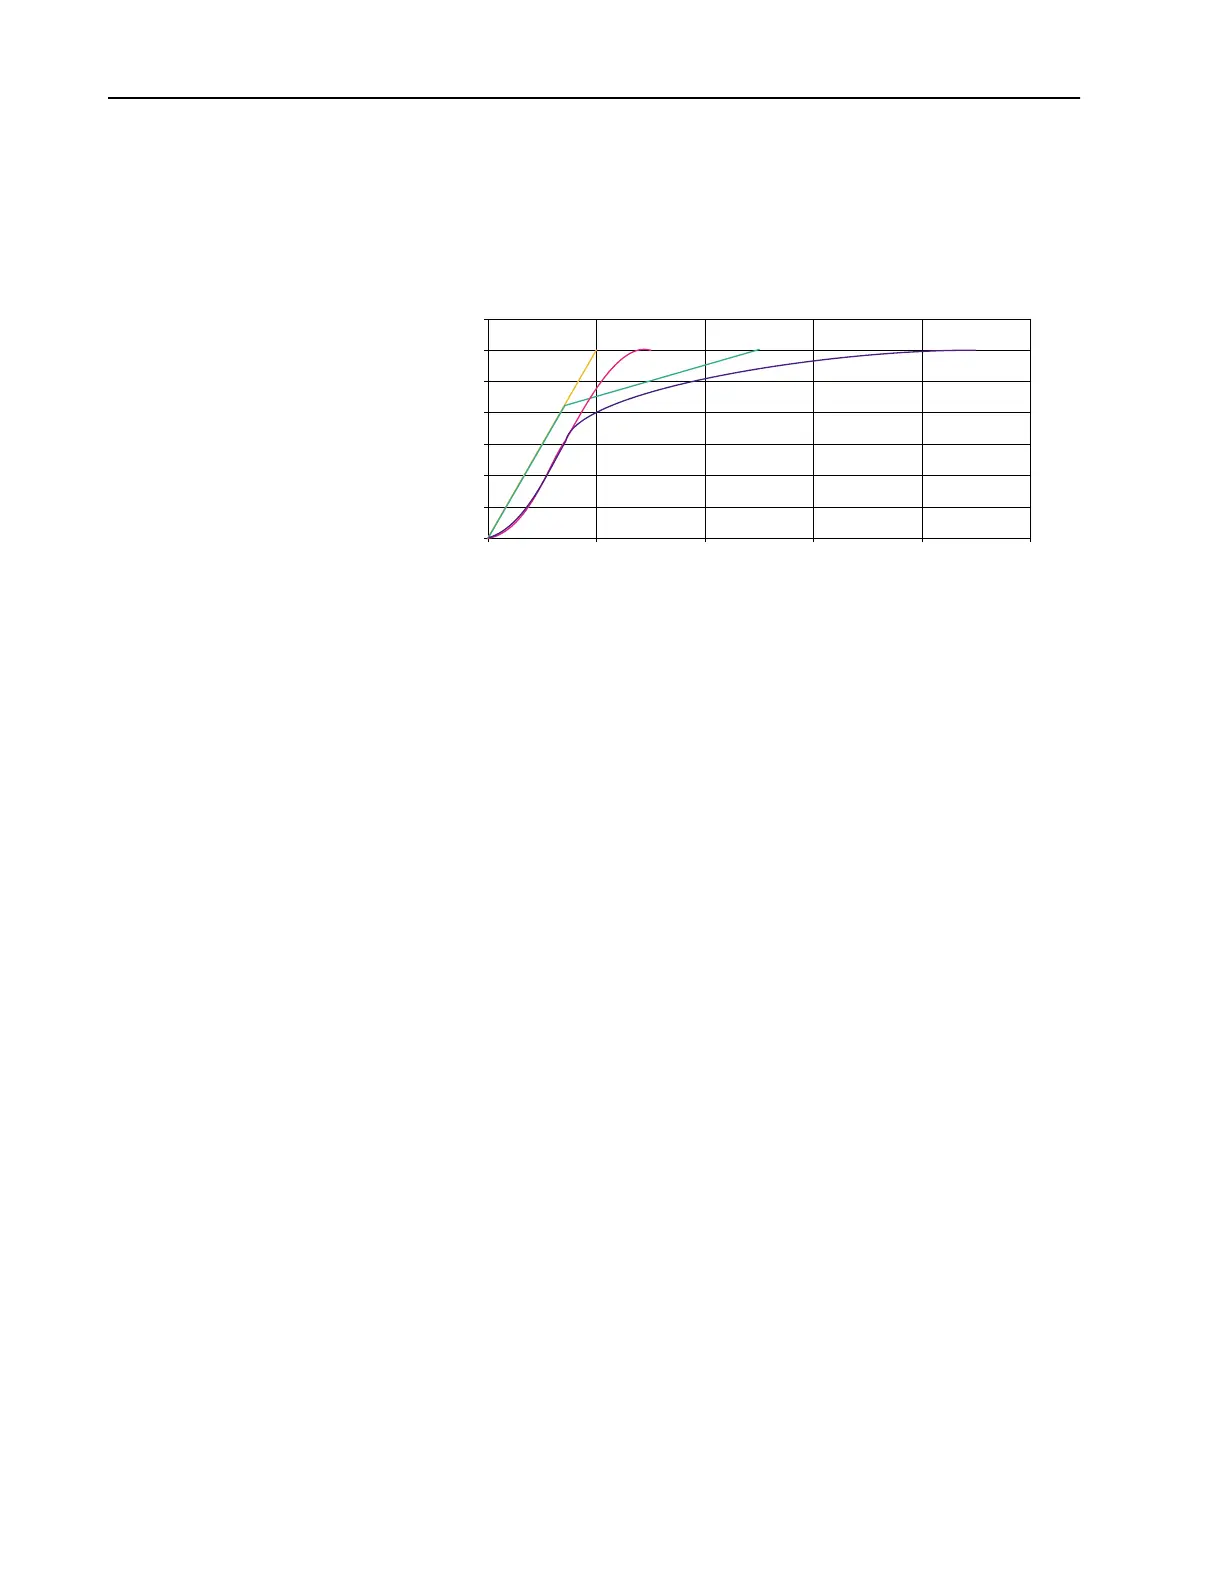
The following graph shows an acceleration time of 1.0 second. After 0.75
seconds, the acceleration time is changed to 6.0 seconds. When the
acceleration rate is changed, the commanded rate is reduced to match the
requested rate based on the initial S-curve calculation. After reaching the
new acceleration rate, the S-curve is then changed to be a function of the
new acceleration rate.
0.0 1.0 2.0 3.0 4.0 5.0
Seconds
Hz
0.0
10.0
20.0
30.0
40.0
50.0
60.0
70.0
 Loading...