47 - 60
IsACQ110C-0 (ENG) Rev.230708-0
Temperature Menu
Oncethedesiredplugshavebeenset,press“Enter” to return
tothepreviousmenu(Fig.59).
The “Conrm” option is automatically selected.
Pressing“Enter”savestheinsertedprogram.
Itisalsopossibletoalterthetemperaturedependingonthe
timeofday.Theusercandothisbysettingthegraph.
To set this function, proceed as follows:
Main screen Main Menu Temperature Programs
Insert.
• Select the temperature reference parameter (Ref.) with
keys , and with keys select the “Curve” option
(Fig.61).
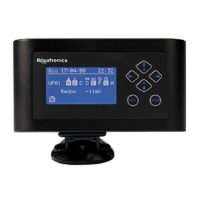
Afterwards,movetothe/\/\/\/\symbolandpress“Enter”.
Ascreenopenswhereitispossibletographicallymodelthe
desiredtemperaturelevelinaspanof24hours(Fig.62).
•Selectthevarioushoursoftheday(in2hourintervals,
lowerleftcorner)withkeys andwithkeysvarythe
temperature(lowerrightcorner)fortheselectedhour.
Press the “Enter”key,whencompleted.
Show/Modify/Delete
Seepage31.
Delete All
Seepage31.
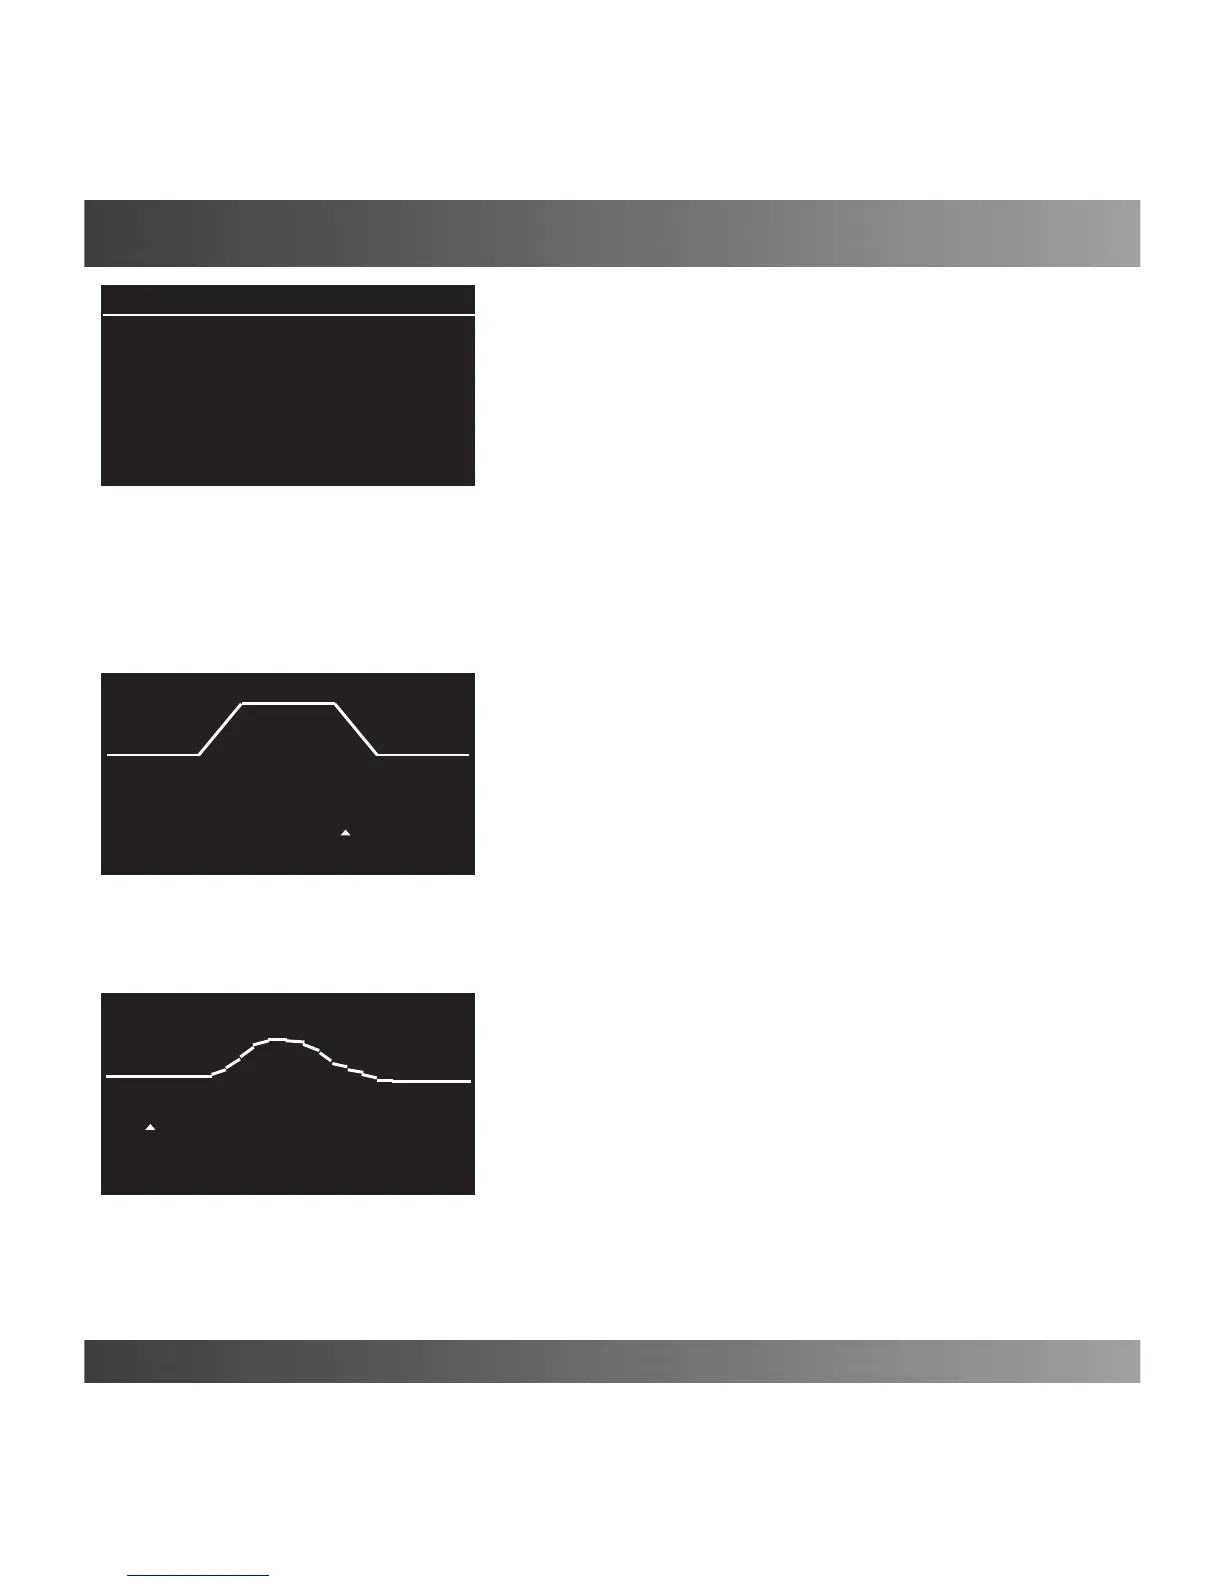
Data Record
Displays,inagraph,thevariationsinthetemperatureofthe
previous24hourswithaminimumintervalof30minutes.
To display the record, proceed as follows:
Main screen Main Menu Temperature Current Data.
• Select the maximum (MAX), minimum (MIN) or current
recordedtemperaturewithkeys,andwithkeys to
moveinsidethegraphandseethetemperatureatthedesired
time(Fig.63).Whennished,press“Enter”.
(Fig. 63)
Current Data
11/06 9:30 26.6°C
(Fig. 62)
18:00 27.0°C
(Fig. 61)
Programs
Curve /\/\/\/\
∆MIN: ∆MAX:
0.3°C 0.5°C
Plugs Conrm
 Loading...