ASD Document 600540 Rev. J 84 FieldSpec® 3 User Manual
www.asdi.com Appendix B Reference Information
B.1.11 Can I post-process my data?
Yes. ViewSpec is one of many applications that can post-process your data.
Various software packages are available for chemometric model. The spectral
data can be imported into many different applications.
The complete specification of the ASD file format is available upon request.
B.1.12 Why do I see oscillations (sine wave) in my data?
Your light source may use AC power. A single SWIR band is about 100 ms. If
you observe five (5) or six (6) waves in a single SWIR, the AC light source is
the cause.
Waves can also occur if the lamp reflector and/or cover glass behave as a
white-light interferometer. Solution: remove the glass and/or use a more
diffuse reflector.
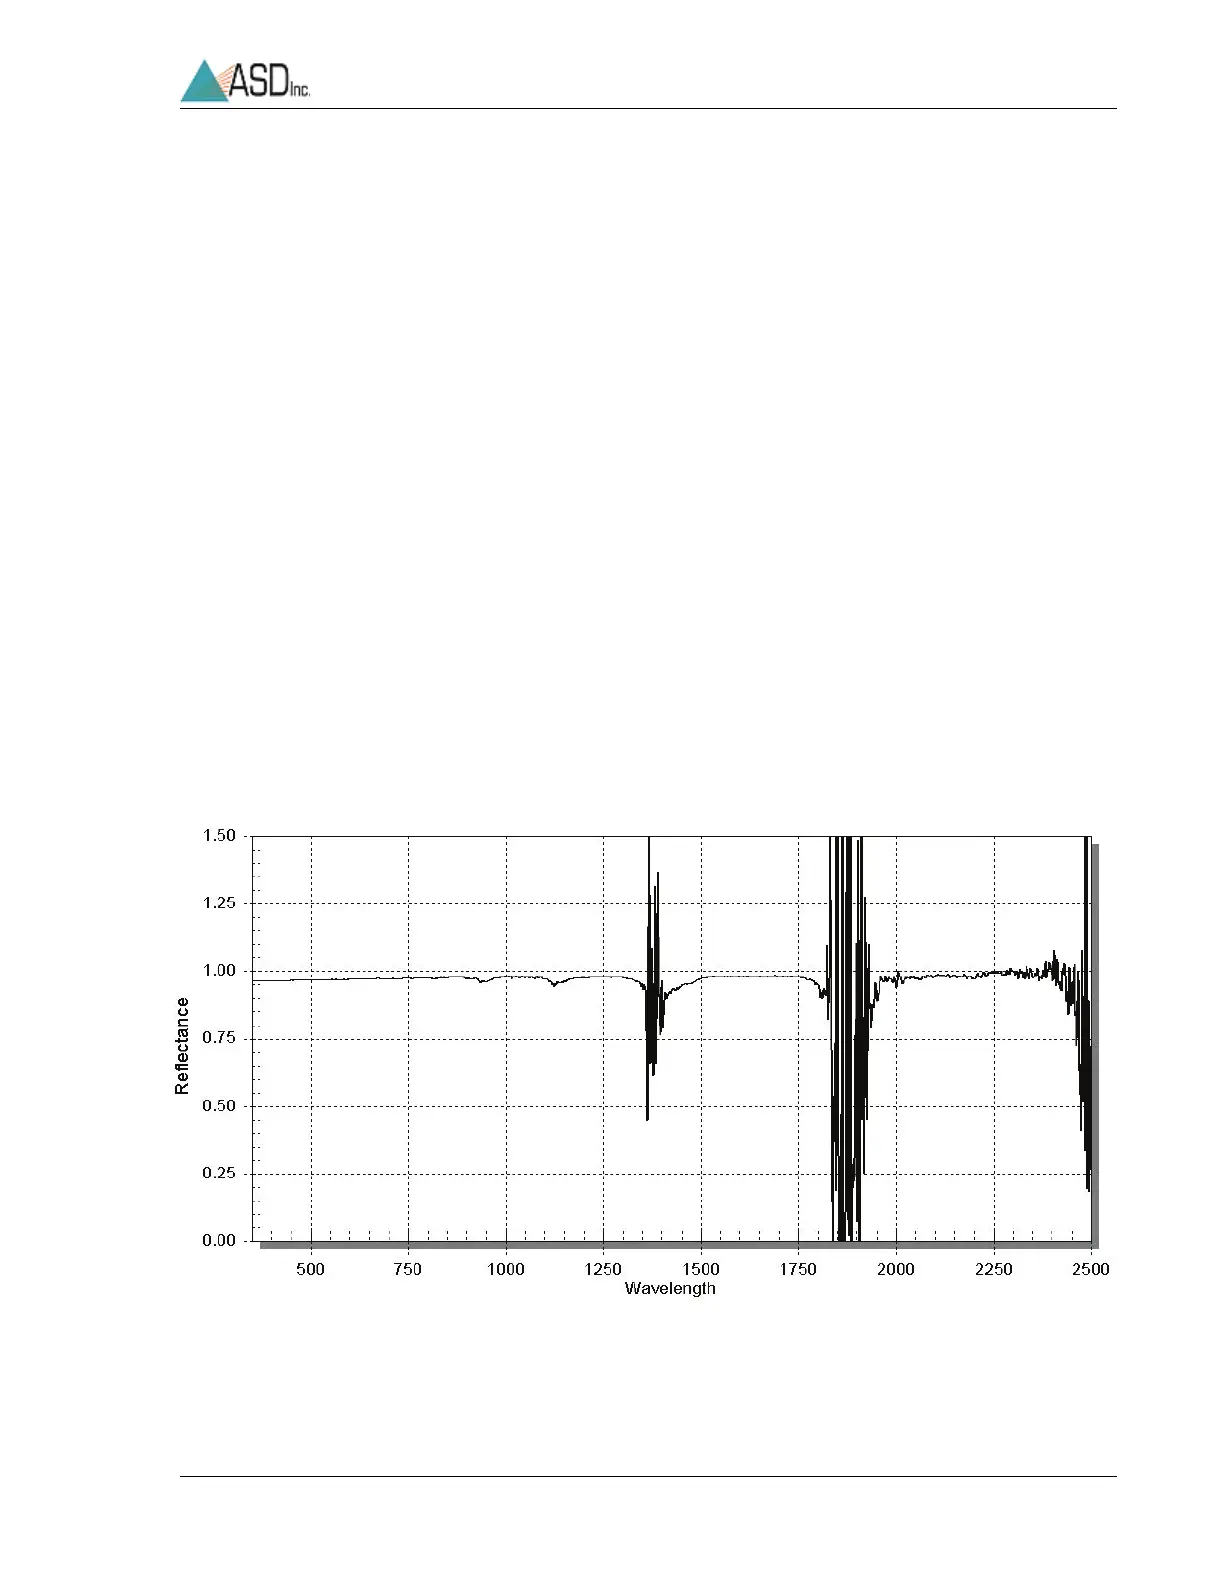
B.1.13 What are these two large noise bands in my data?
Water vapor in the atmosphere absorbs light in the 1400 nm and 1800 nm
bands.
Figure B-2 Examples of water vapor absorbing light.