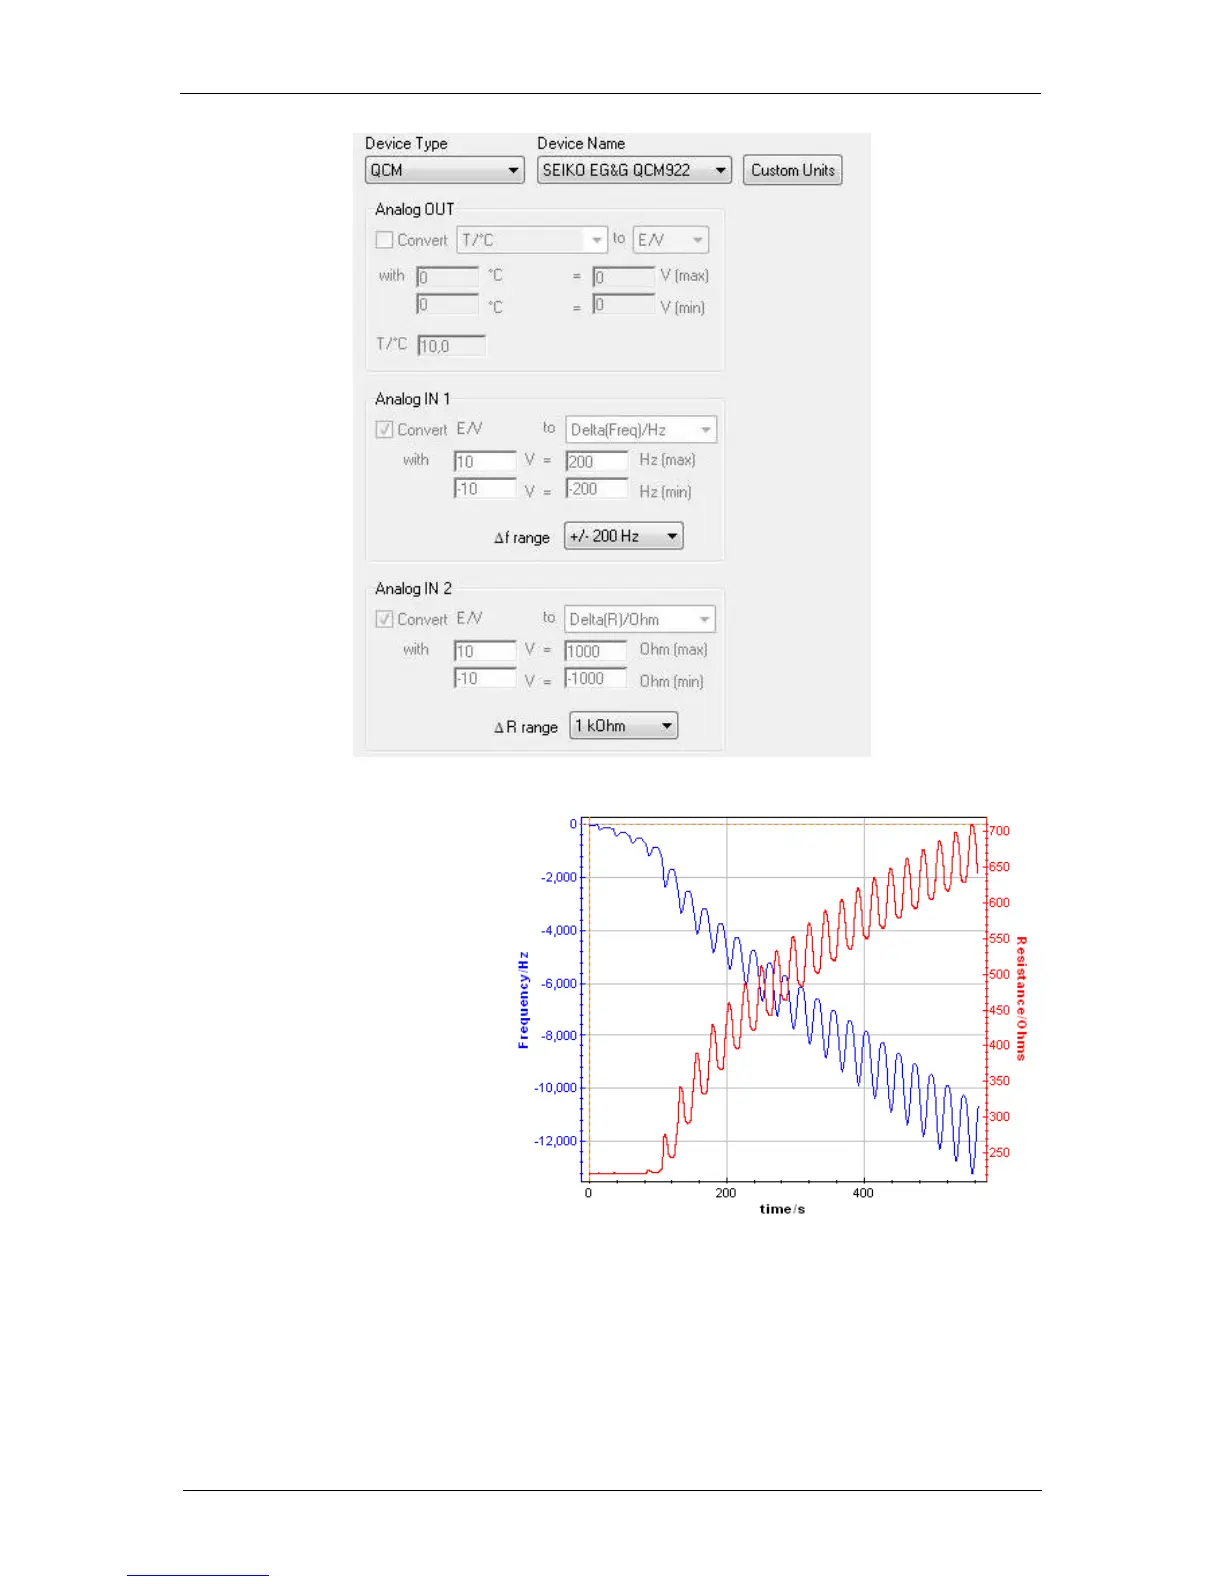
One can see that both frequency
and resistance variations are
recorded on the potentiostat
analog inputs. The user has to
define both the frequency range
and the resistance range. The
results of this experiment are
displayed to the right.
A process is also available to
calculate the amount of a
species electro-disposed onto
the QCM. To use this process,
select the process data option in
the Analysis menu.
Fig. 90: Frequency and resistance variations
recorded from the analog inputs for an instrument
coupled with a SEIKO EG&G QCM 922.