46 | S3 Cell Sorter Instruction Manual46 |
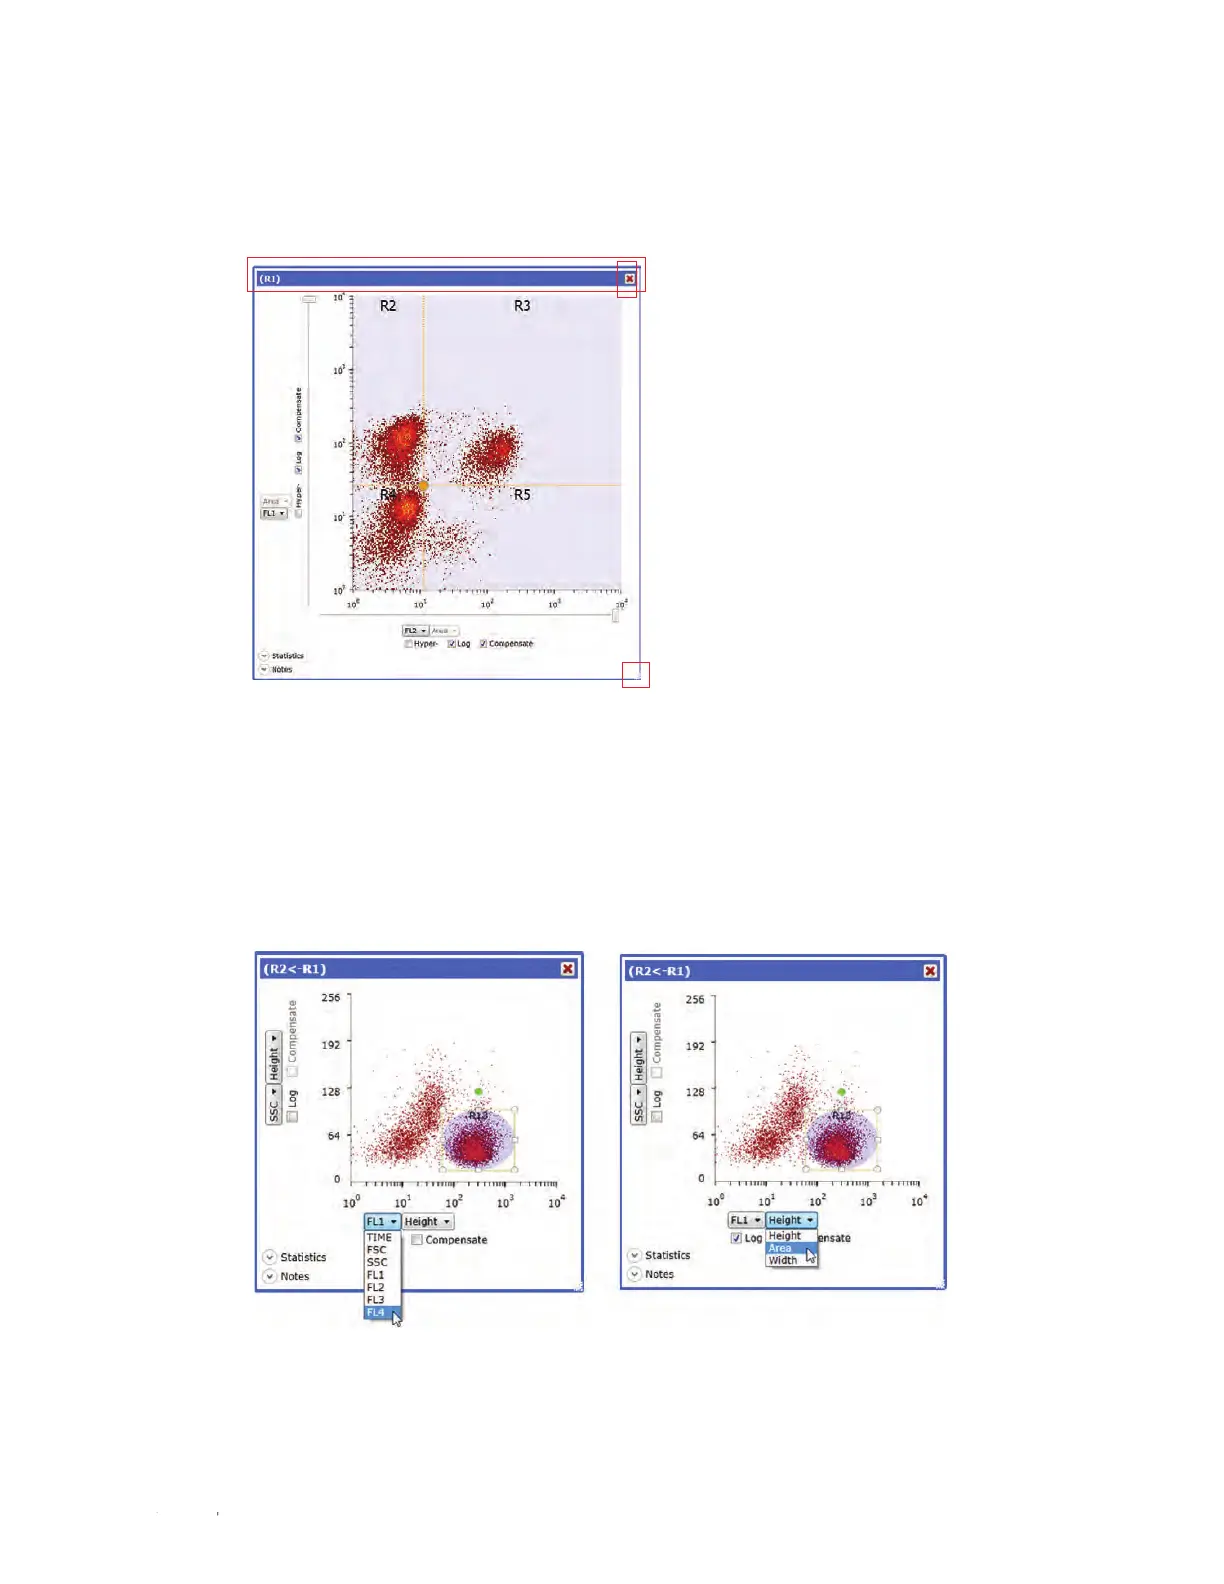
Plots can be moved within the workspace by grabbing the bar at the top and dragging to the
desired position. The remaining plots will shift accordingly. To delete a plot, click the red X in the
upper right corner. This will delete the selected plot (Figure 48).
4.5.10 Changing Parameters
To change the parameters displayed in a plot, click the dropdown arrow and select a parameter
(Figure 49). If a log or compensated parameter is desired, check the appropriate box.
Fig. 48. Density plot with resizing, moving, and
deleting functions highlighted.
Fig. 49. Density plot with parameters displayed.