5 Operation
5.1 Measurement function at single frequency
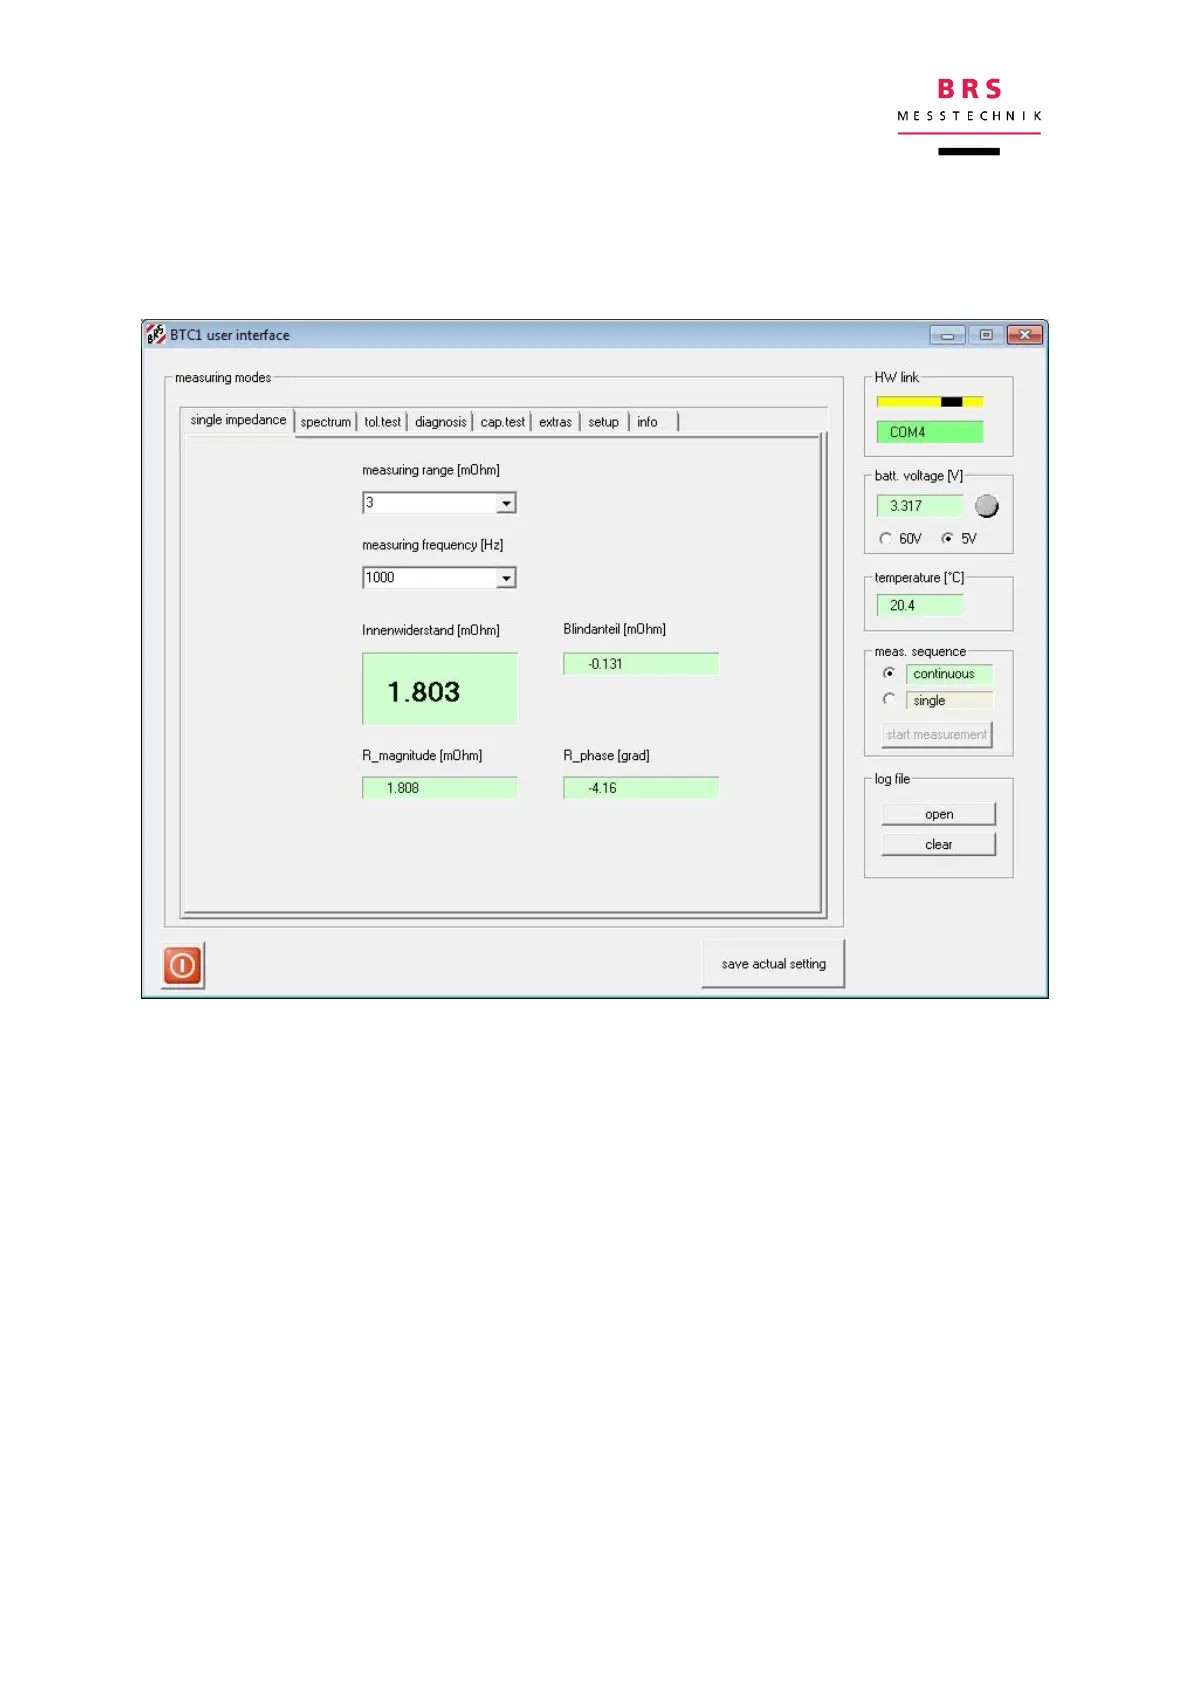
Select the “single impedance” operation by clicking on the relevant tab.
First select the measurement range; the measurement current will automatically ad-
justed. Then choose the measuring frequency from a set of 24 predefined frequen-
cies.
The impedance Z is displayed in two forms: by real part and imaginary part and by
magnitude and phase. The real part represents the active resistance component and
the imaginary part shows the inductive or capacitative blind part. Positive imaginary
parts show inductance, negative imaginary parts show capacities. The frequency plot
is called Nyquist chart.
An alternative representation is in polar form as magnitude an phase. The frequency
plot of these 2 variables is a Bode plot.