5.2 Measurement function for spectral measurement
In the “spectrum” measurement type, there are periodic frequency scans, i.e. all
measurement frequencies, starting with the highest frequency of 1kHz are measured
one after the other
.
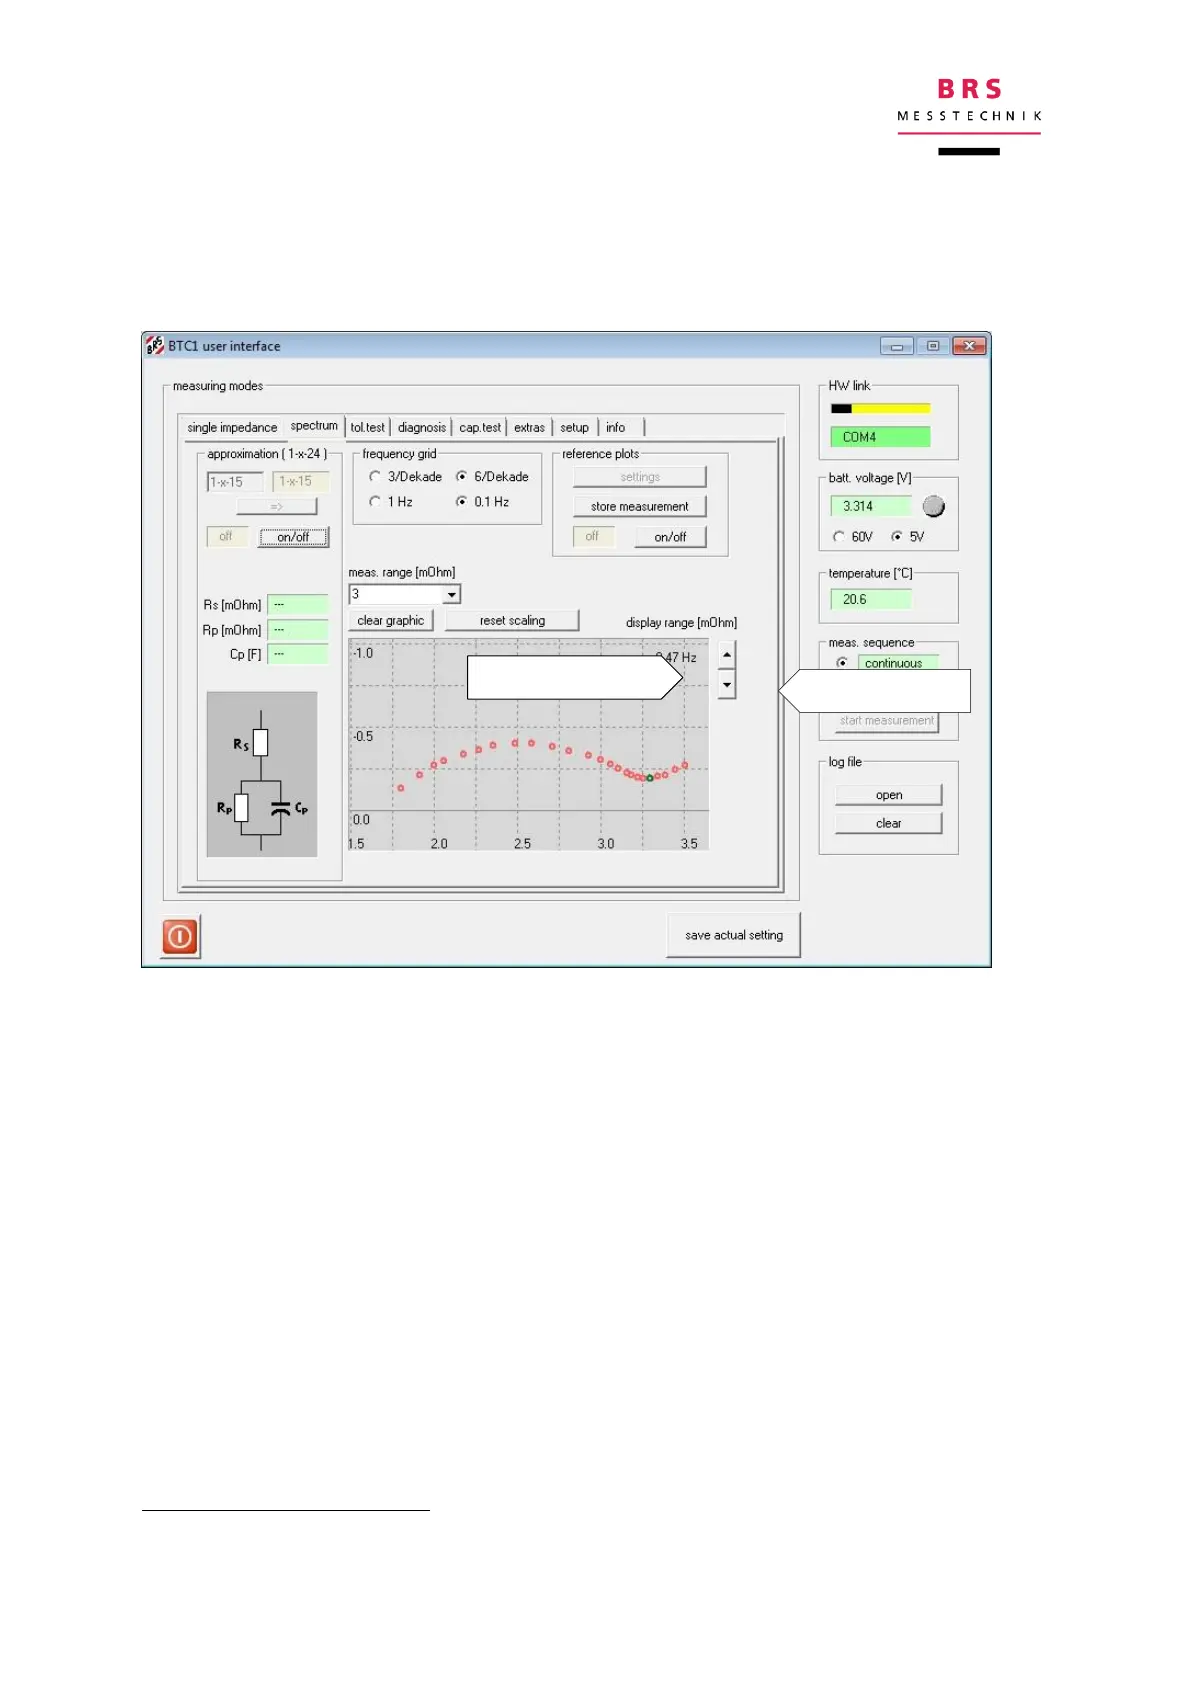
The results are shown as a frequency response plot by real and imaginary parts with
the frequency as a parameter. This display is also known as a Nyquist plot. The real
part (ohmic component) is plotted horizontally; the imaginary part is on the vertical
axis. It is customary for the negative imaginary axis to be shown vertically so that the
capacities (negative imaginary part) can be shown in the first quadrant, as this gives
a better overview.
The impedance with the lowest value and highest frequency is on the left-hand side
of the Nyquist curve; the impedance with the highest value and lowest frequency is
on the right-hand side of the curve.
New values are added to the diagram, and the older values are overwritten. The
“clear graphic” button deletes all of the values.
The display area can be changed using the directional arrows independently of the
measurement range. You can move the graphic horizontally by clicking into the
graphic with the left mouse button and holding the button down.
This type of measurement is also known as EIS (Electric Impedance Spectroscopy).