5.4 Evaluation function tolerance test
This function compares measured values with must values. Maximum allowed devia-
tions can be specified by a tolerance. If the measured value lies inside the tolerance,
the tolerance test is passed (OK), if the measured values are outside, the result is
NOK (not ok).
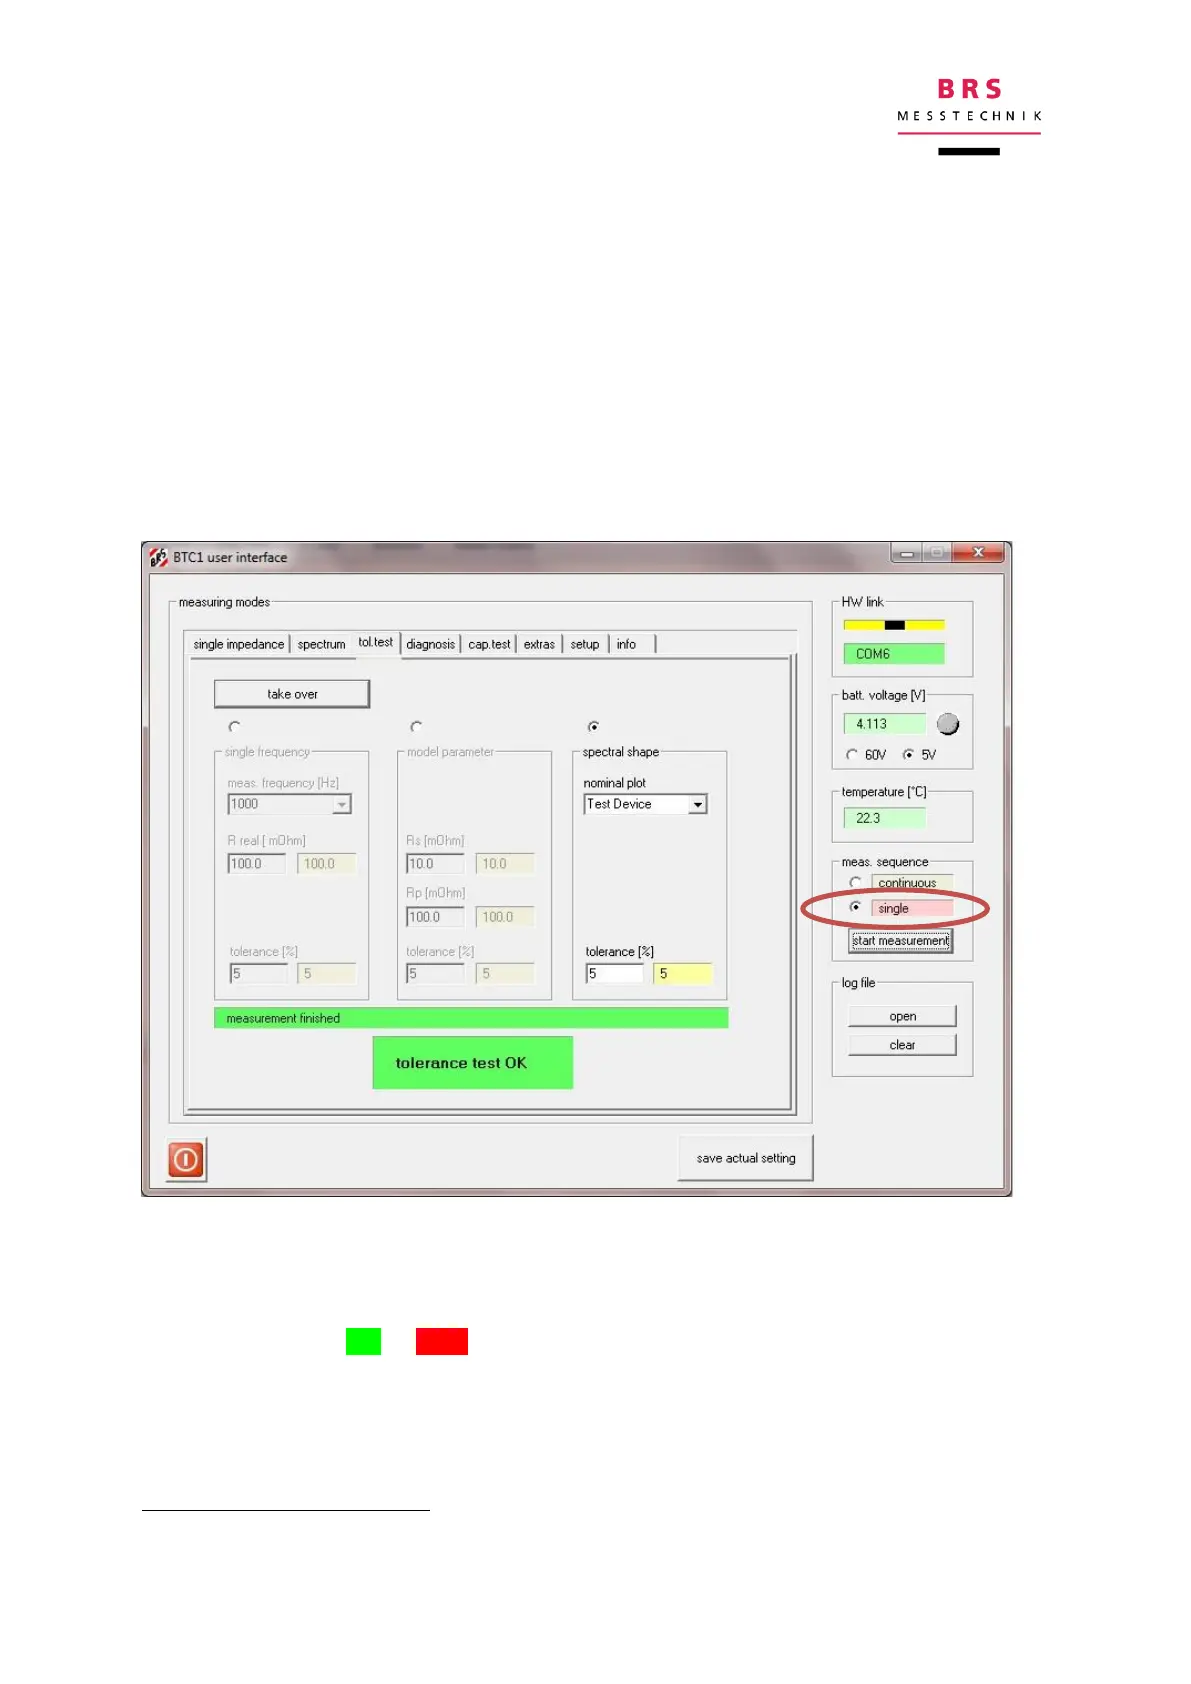
Must values can be specified either as single frequency measurements, model pa-
rameters or spectral shape (Nyquist plot). For each type, individual reference values
and tolerances can be specified. The entered values are activated with the “take
over” button. The nominal plot (must curve) for the spectral shape is selected from
the reference plots in the menu “spectrum”
.
For starting the measurement process, first select single scan mode, then activate
the “start measurement” button. During measurement a red bar indicates “measure-
ment running”; it changes to a green bar, when the measurement is finished.
The result is either OK or NOK, the detailed results are stored in the log file and as
csv data.
An individual curve can be defined in the format of the file „RefPlot.txt”.