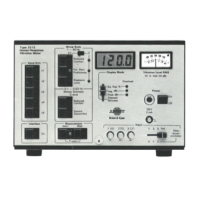
3.
On
the
4426:
a.
Turn the DISPLAY control on the front panel to "Sound Level".
b.
Turn the FUNCTION SELECTOR through
"Reset"
to the
"Standby"
position.
c.
Select the sample period to be less than the time constant
of
the measurement mode
being used. This setting will determine the minimum measurement duration because the
minimum number
of
samples which can be set is
1000.
d. Using a small screwdriver, adjust the DIRECT SENS. screw beside the DIRECT input
socket on the rear panel so that the display shows a value which is
20
dB above the
bottom
of
the range selected on the RANGE control. For example, if the RANGE control is
in the "66 -
130
dB"
position, the 4426 display will read 86,0 dB, i.e.
34
dB below the actual
reference level, if the RANGE is "46 -
110
dB", it will display 66,0 dB, i.e.
54
dB below the
actual reference level, etc
..
These corrections will have to be added to the values
displayed
on
the 4426 if the analysis is recorded manually from the display,
or
to the
printed values if the analysis is output to the Alphnumeric Printer Type 2312
This procedure sets the bottom
of
the range on the 2512 (i.e.
100
dB nominal in WHOLE BODY
mode
or
120
dB nominal in HAND - ARM mode) to correspond with the bottom
of
the range se-
lected on the
4426.
This in turn allows the whole
of
the dynamic range
of
the 2512 to be
conveniently covered by the 4426 and the results to be easily interpreted from a level recorder
plot.
4.
Set up the Type 2512 to carry out the desired measurement as described
in
section
3.4.
For full details of operation
of
the Noise Level Analyzer Type 4426 and recording
of
statistical
distributions and cumulative histograms using the Portable Level Recorder Type
2306,
refer-
ence should be made to the instruction manuals for these instruments.
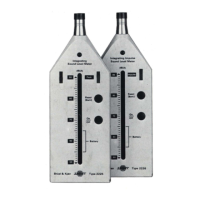
Using the scale SC 2363
The Scale SC 2363 is similar in use to that delivered with the Type 4426
for
finding the
LN
values when measuring noise, SC 2362. It is transparent and designed to be placed over the
cumulative histogram
or
statistical distribution as a simple means
of
calibration as shown in
Figures 4.5
to
4.8.
DDDDDuuuuuuuuuuuuuuuuuuuuuuuuuuuuuuuuuuuuuuut
µDODOO
Bruel &
Kja,r
Bruel
&
Kja,r
100% 25%
-
80
.
20
60
.
15
40
.
10
.
20
5
·.
L10
127 dB
.
0
0
OP
0102
100
110
120
130
140
150 160
170 dB
8
10426
v,
1--
0,3
--1--
3
--
10 - 30 - 100- 300 ms- 2
WB
·
HA
Fig.
4.5.
Lining up the Scale SC 2363
over
a cumulative
plot
of
Whole
Body
vibration measurements
35
 Loading...