MATRON-Light with 2250-M Field Guide, Page 33
You may need to click on
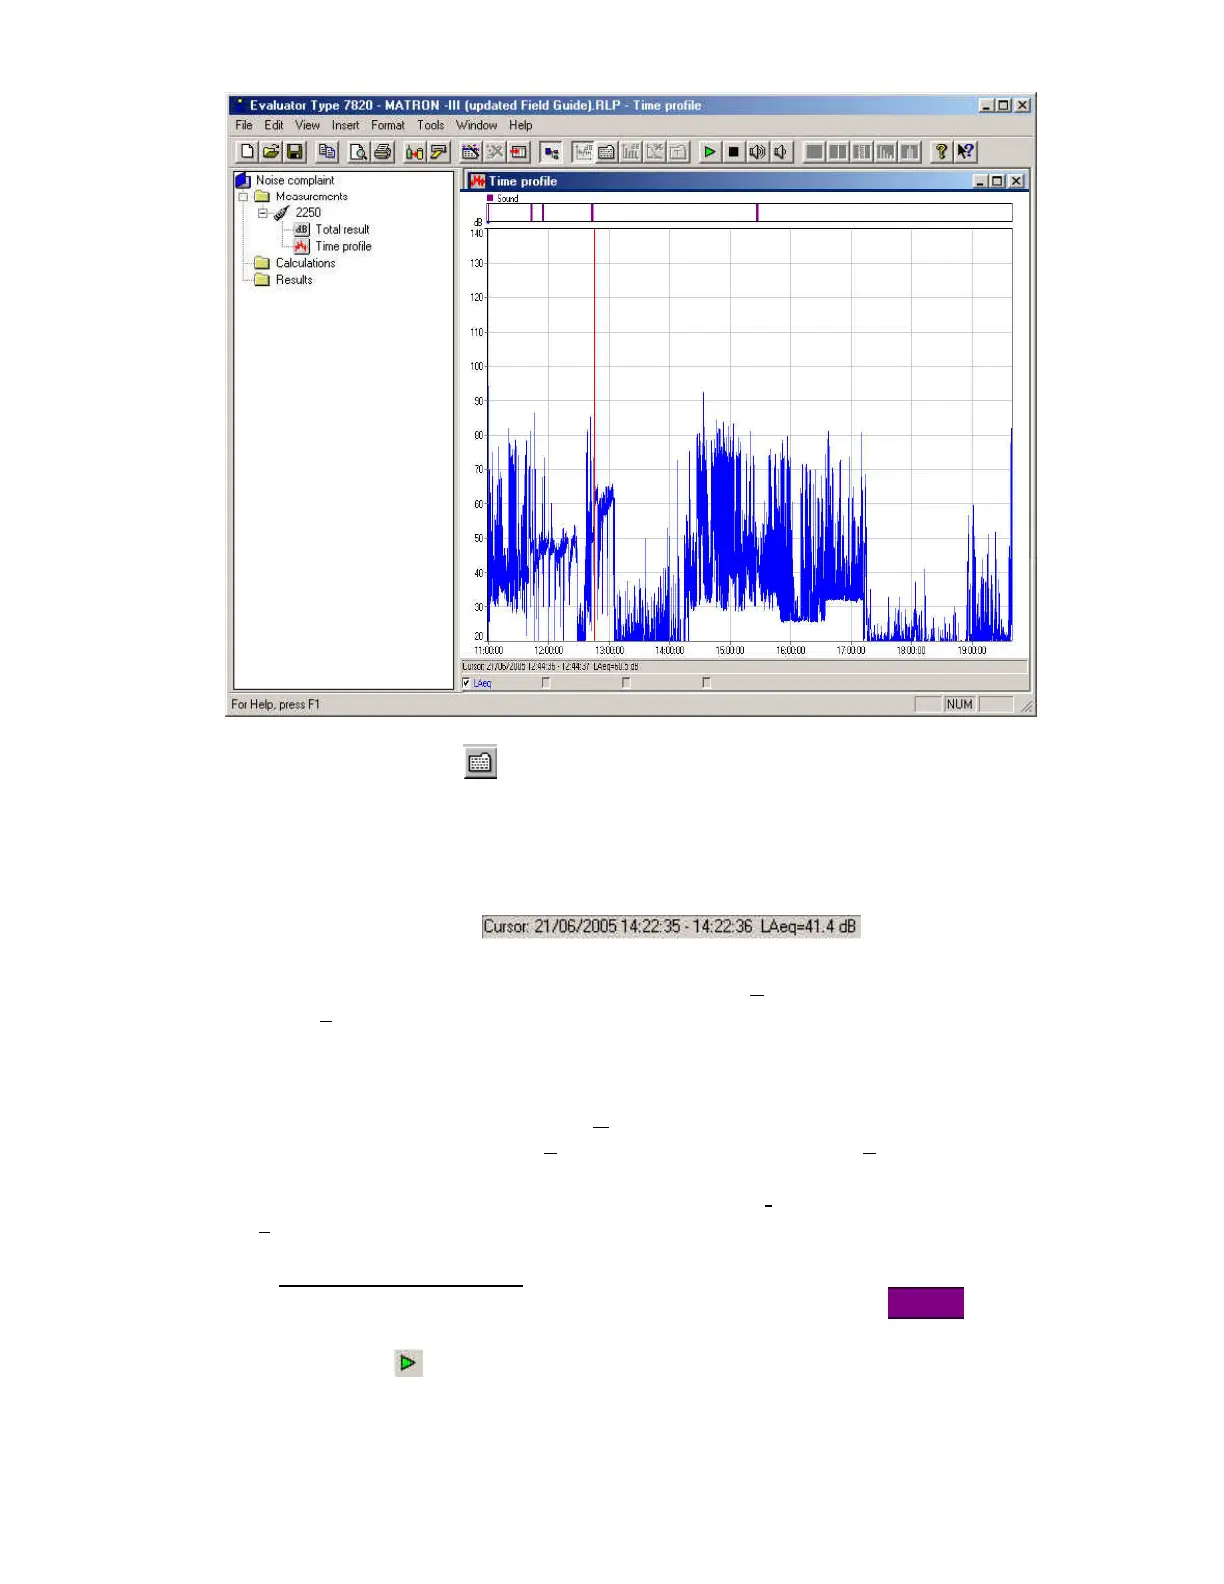
(Toggle Text) to obtain a layout similar to that above.
10.5 You can experiment with the display to see how to present it as you wish.
Position the mouse pointer on the graph and try:
moving the cursor with mouse pointer movement and left-click or using the
or
keyboard arrows (the
under the
graph shows your selected time)
left-clicking and dragging the mouse pointer (leads to Z
oom range and Adjust
(time) S
election…).
zoom a section. (Then move the or computer keyboard arrows to either end
and continue holding down: the zoomed graph continues through the time
history).
right-click a zoomed graph to reveal U
nzoom, zoom in and zoom out.
right-click on a graph to reveal P
roperties. Move mouse pointer to Properties and
left-click to reveal tabs for Axis, Legend and Markers and Export.
Left-click the Axis tab and try changing the range from I
nstrument Range to User
d
efined: 20dB to 110dB.
10.6
Listen to your recordings
.
Position the mouse pointer anywhere before a recording marked as
just above the time profile graph.
10.7 Click on the
(Play sound) button just above the profile graph and the cursor
will automatically move to the start of the recording. You will be able to hear
your recording playing back though the computers internal speaker (not
 Loading...