5-26
• Certain functions can be graphed easily using built-in function graphs.
• You can draw graphs of the following built-in scientific functions.
Rectangular Coordinate Graph Polar Coordinate Graph
• sin x • cos x • tan x • sin
–1
x
• cos
–1
x • tan
–1
x • sinh x • cosh x
• tanh x • sinh
–1
x • cosh
–1
x • tanh
–1
x
• 'x • x
2
• log x • lnx
• 10
x
• e
x
• x
–1
•
3
'x
• • •
• sin
θ
• cos
θ
• tan
θ
• sin
–1
θ
• cos
–1
θ
• tan
–1
θ
• sinh
θ
• cosh
θ
• tanh
θ
• sinh
–1
θ
• cosh
–1
θ
• tanh
–1
θ
• '
θ
•
θ
2
• log
θ
• ln
θ
• 10
θ
• e
θ
•
θ
–1
•
3
'
θ
- Input for x and
θ
variables is not required for a built-in function.
- When inputting a built-in function, other operators or values cannot be input.
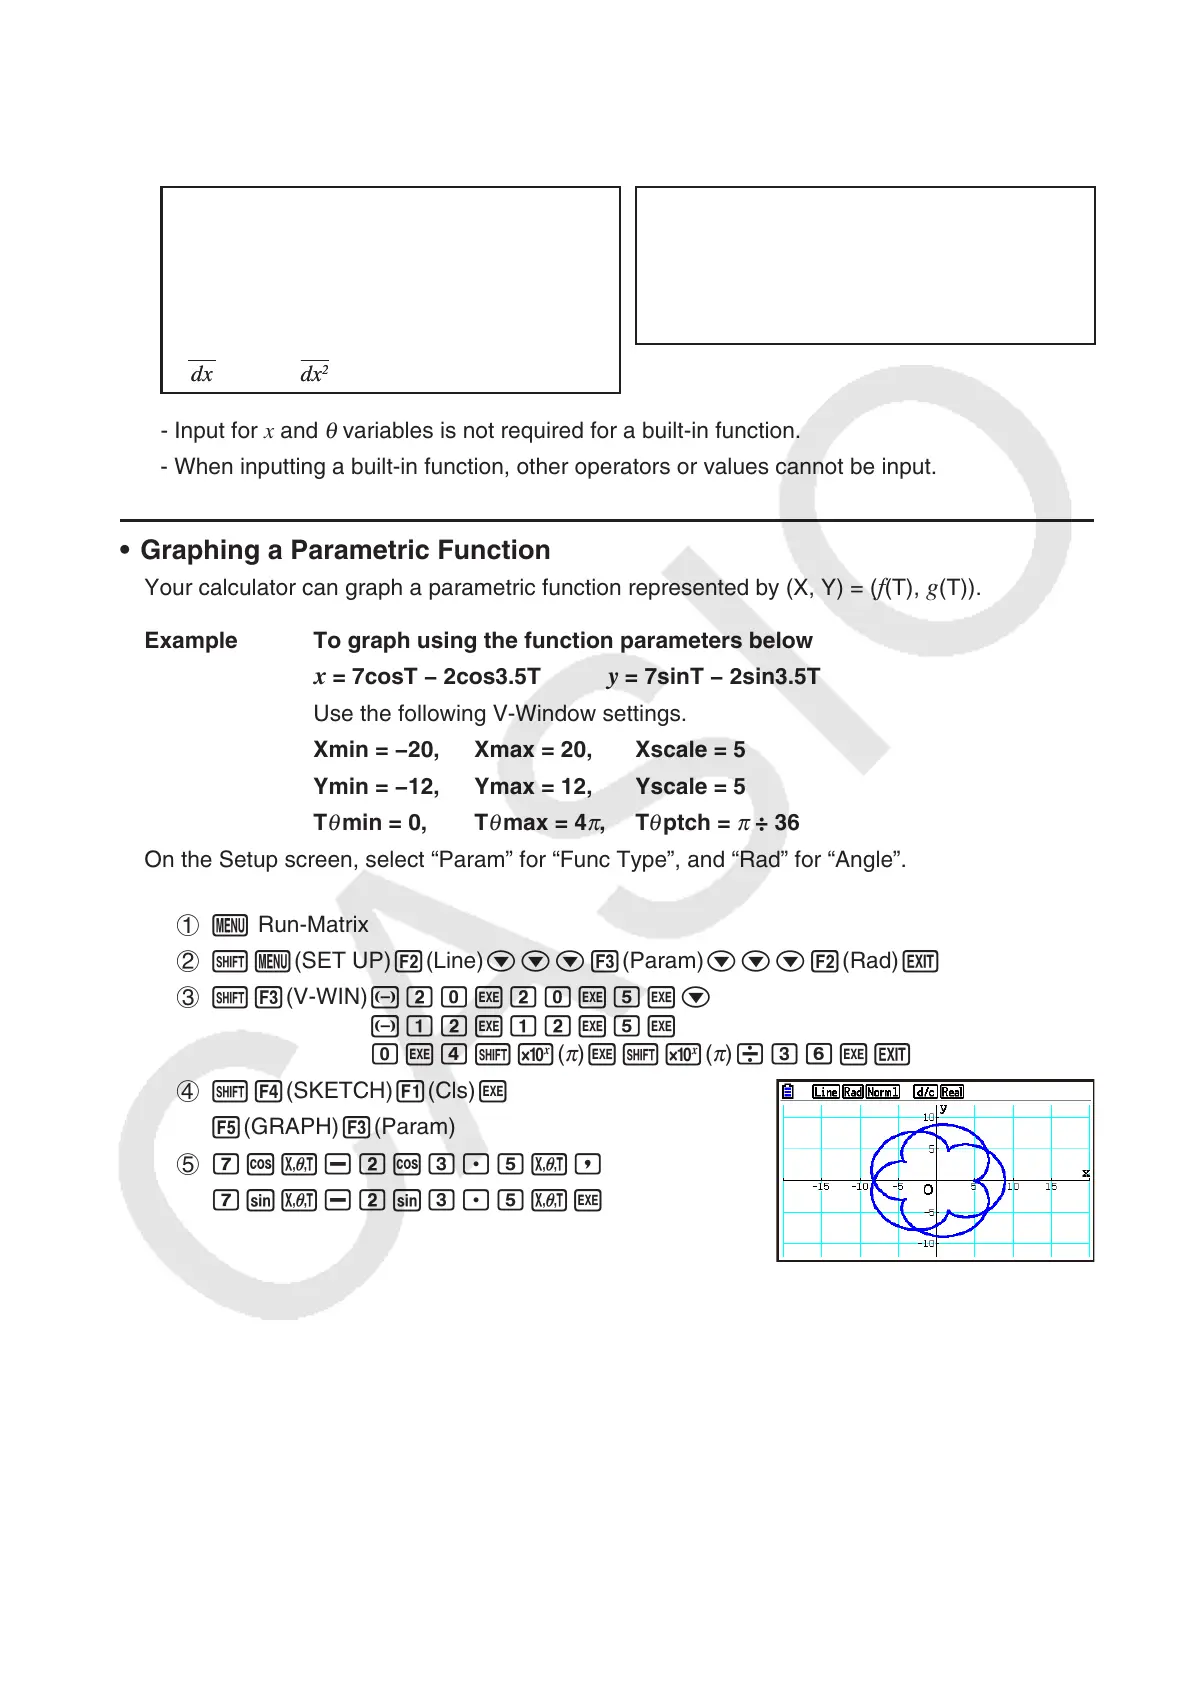
• Graphing a Parametric Function
Your calculator can graph a parametric function represented by (X, Y) = (f(T), g(T)).
Example To graph using the function parameters below
x = 7cosT − 2cos3.5T y = 7sinT − 2sin3.5T
Use the following V-Window settings.
Xmin = −20, Xmax = 20, Xscale = 5
Ymin = −12, Ymax = 12, Yscale = 5
T
θ
min = 0, T
θ
max = 4
π
, T
θ
ptch =
π
÷ 36
On the Setup screen, select “Param” for “Func Type”, and “Rad” for “Angle”.
1 m Run-Matrix
2 !m(SET UP)2(Line)ccc3(Param)ccc2(Rad)J
3 !3(V-WIN) -cawcawfwc
-bcwbcwfw
awe!5(
π
)w!5(
π
)/dgwJ
4 !4(SKETCH)1(Cls)w
5(GRAPH)3(Param)
5 hcv-ccd.fv,
hsv-csd.fvw
dx
(
x
)
d
dx
(
x
)
d
dx
2
(
x
)
d
2
dx
2
(
x
)
d
2
∫(
x
)
dx
∫(
x
)
dx