5-27
• Graphing an Integration
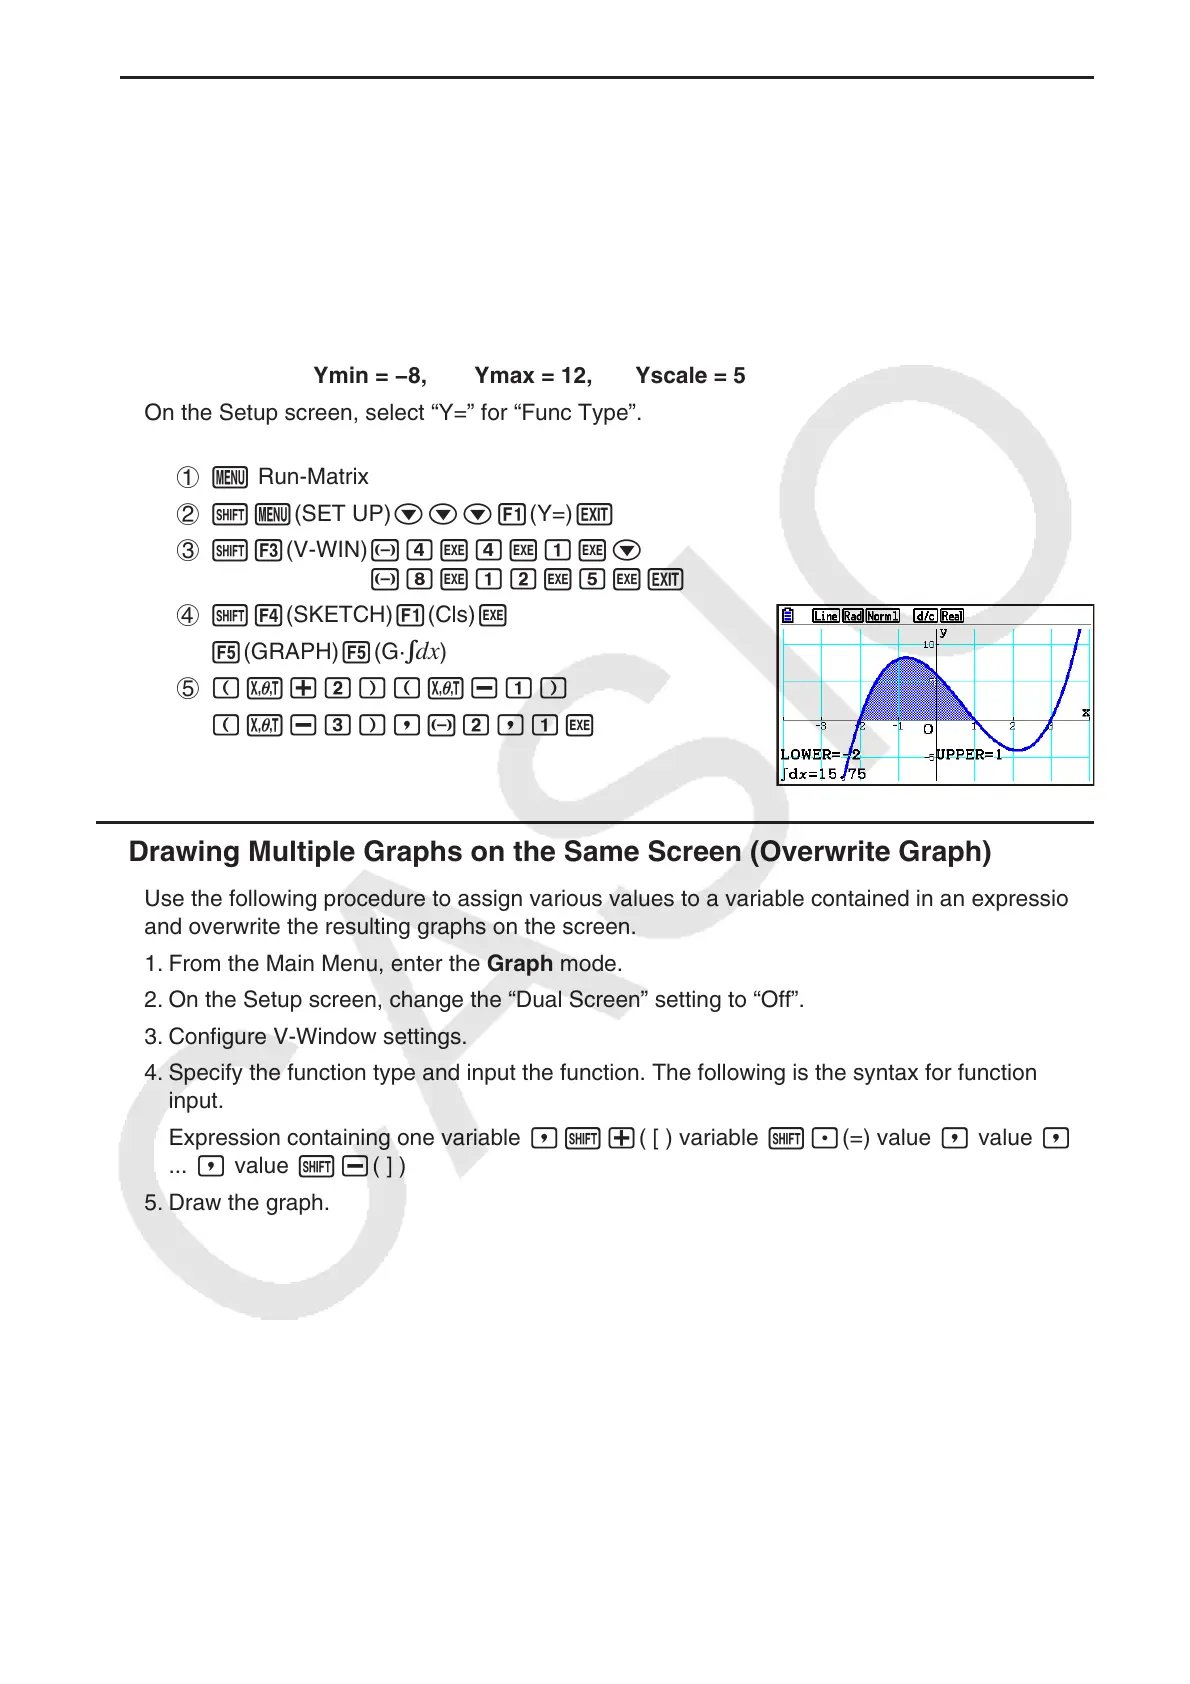
Your calculator can graph a function that performs integration calculation.
Calculation results are displayed in the lower left corner of the screen, with the integration area
filled in.
Example To graph the integration formula
1
–2
∫
(x + 2)(x – 1)(x – 3) dx
Use the following V-Window settings.
Xmin = −4, Xmax = 4, Xscale = 1
Ymin = −8, Ymax = 12, Yscale = 5
On the Setup screen, select “Y=” for “Func Type”.
1 m Run-Matrix
2 !m(SET UP)ccc1(Y=)J
3 !3(V-WIN) -ewewbwc
-iwbcwfwJ
4 !4(SKETCH)1(Cls)w
5(GRAPH)5(G·
dx)
5 (v+c)(v-b)
(v-d),-c,bw
k Drawing Multiple Graphs on the Same Screen (Overwrite Graph)
Use the following procedure to assign various values to a variable contained in an expression
and overwrite the resulting graphs on the screen.
1. From the Main Menu, enter the Graph mode.
2. On the Setup screen, change the “Dual Screen” setting to “Off”.
3. Configure V-Window settings.
4. Specify the function type and input the function. The following is the syntax for function
input.
Expression containing one variable ,!+( [ ) variable !.(=) value , value ,
... , value !-( ] )
5. Draw the graph.