5-29
k Using a List to Simultaneously Draw Multiple Graphs (List Graph)
You can use a list to simultaneously draw multiple graphs by substituting list data for a
coefficient within an expression registered on the graph relation list screen.
Example: List 1 = {1,2,3}, List 2 = {4,5,6}
• Registering and graphing the expression Y1 = (List 1)X
2
will simultaneously draw graphs for
the following three expressions:
Y = X
2
, Y = 2X
2
, Y = 3X
2
• Registering and graphing the expression Y1 = (List 1)X
2
− (List 2) will simultaneously draw
graphs for the following three expressions:
Y = X
2
− 4, Y = 2X
2
− 5, Y = 3X
2
− 6
Important!
If you want to use multiple lists within a registered expression, all of the lists must have the
same number of elements. A Dimension ERROR will occur if a list that does not have the
same number of elements as the other lists is included.
u To use a list to simultaneously draw multiple graphs
1. Use the List Editor (Chapter 3) to register the list(s) you want to use.
2. From the Main Menu, enter the Graph mode.
3. On the Setup screen, change the “Dual Screen” setting to “Off”.
4. Configure V-Window settings.
5. Register an expression with a coefficient that uses the list(s) data.
6. Draw the graph.
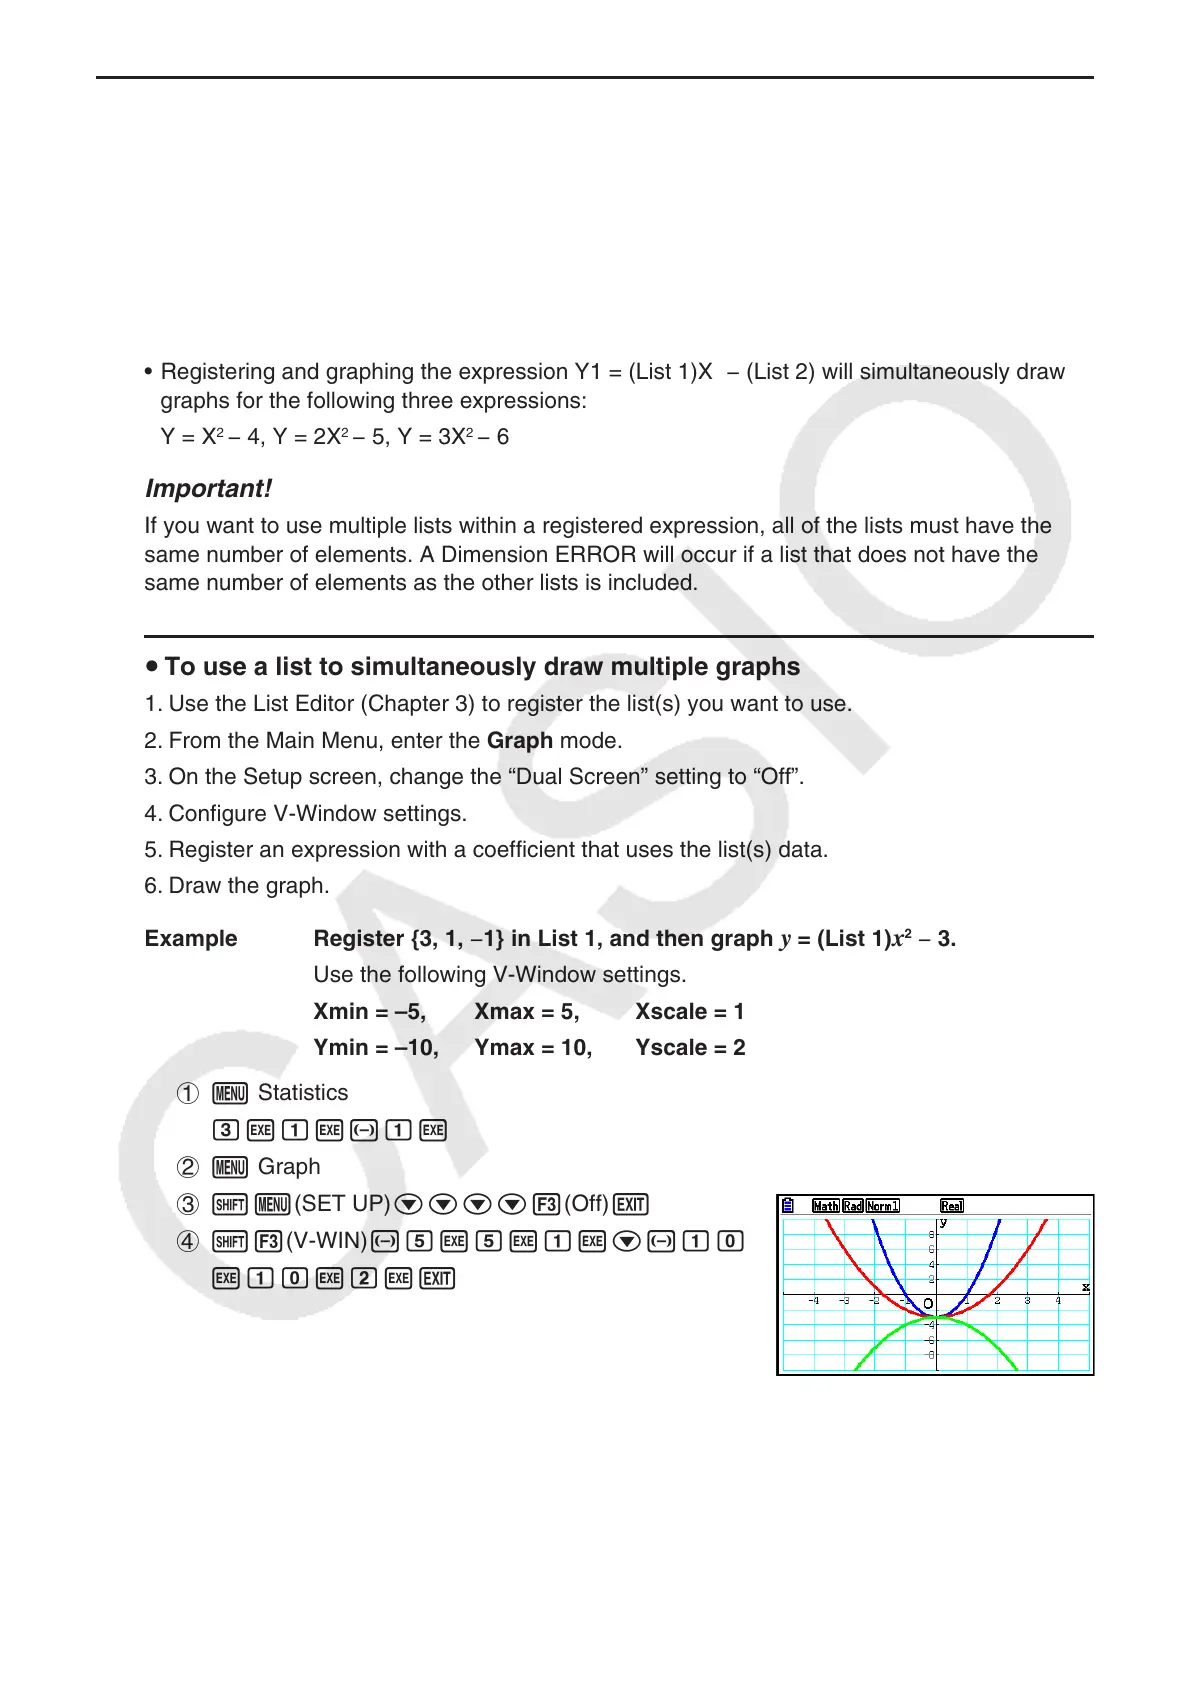
Example Register {3, 1, −1} in List 1, and then graph
y = (List 1)x
2
− 3.
Use the following V-Window settings.
Xmin = –5, Xmax = 5, Xscale = 1
Ymin = –10, Ymax = 10, Yscale = 2
1 m Statistics
dwbw-bw
2 m Graph
3 !m(SET UP)cccc3(Off)J
4 !3(V-WIN)-fwfwbwc-ba
wbawcwJ
5 3(TYPE)1(Y=)!b(List)bvx-dw
6 6(DRAW)