6-43
You can use the following graph analysis functions after drawing a graph.
• 1(F) ... Displays F value.
Pressing 1(F) displays the F value at the bottom of the display, and displays the pointer at
the corresponding location in the graph (unless the location is off the graph screen).
Two points are displayed in the case of a two-tail test. Use d and e to move the pointer.
• 2(P) ... Displays p -value.
Pressing 2(P) displays the p -value at the bottom of the display without displaying the
pointer.
• Executing an analysis function automatically stores the F and p values in variables F and P,
respectively.
• [Save Res] does not save the σ
1
condition in line 2.
k ANOVA
ANOVA tests the hypothesis that the population means of the samples are equal when there
are multiple samples.
One-Way ANOVA is used when there is one independent variable and one dependent
variable.
Two-Way ANOVA is used when there are two independent variables and one dependent
variable.
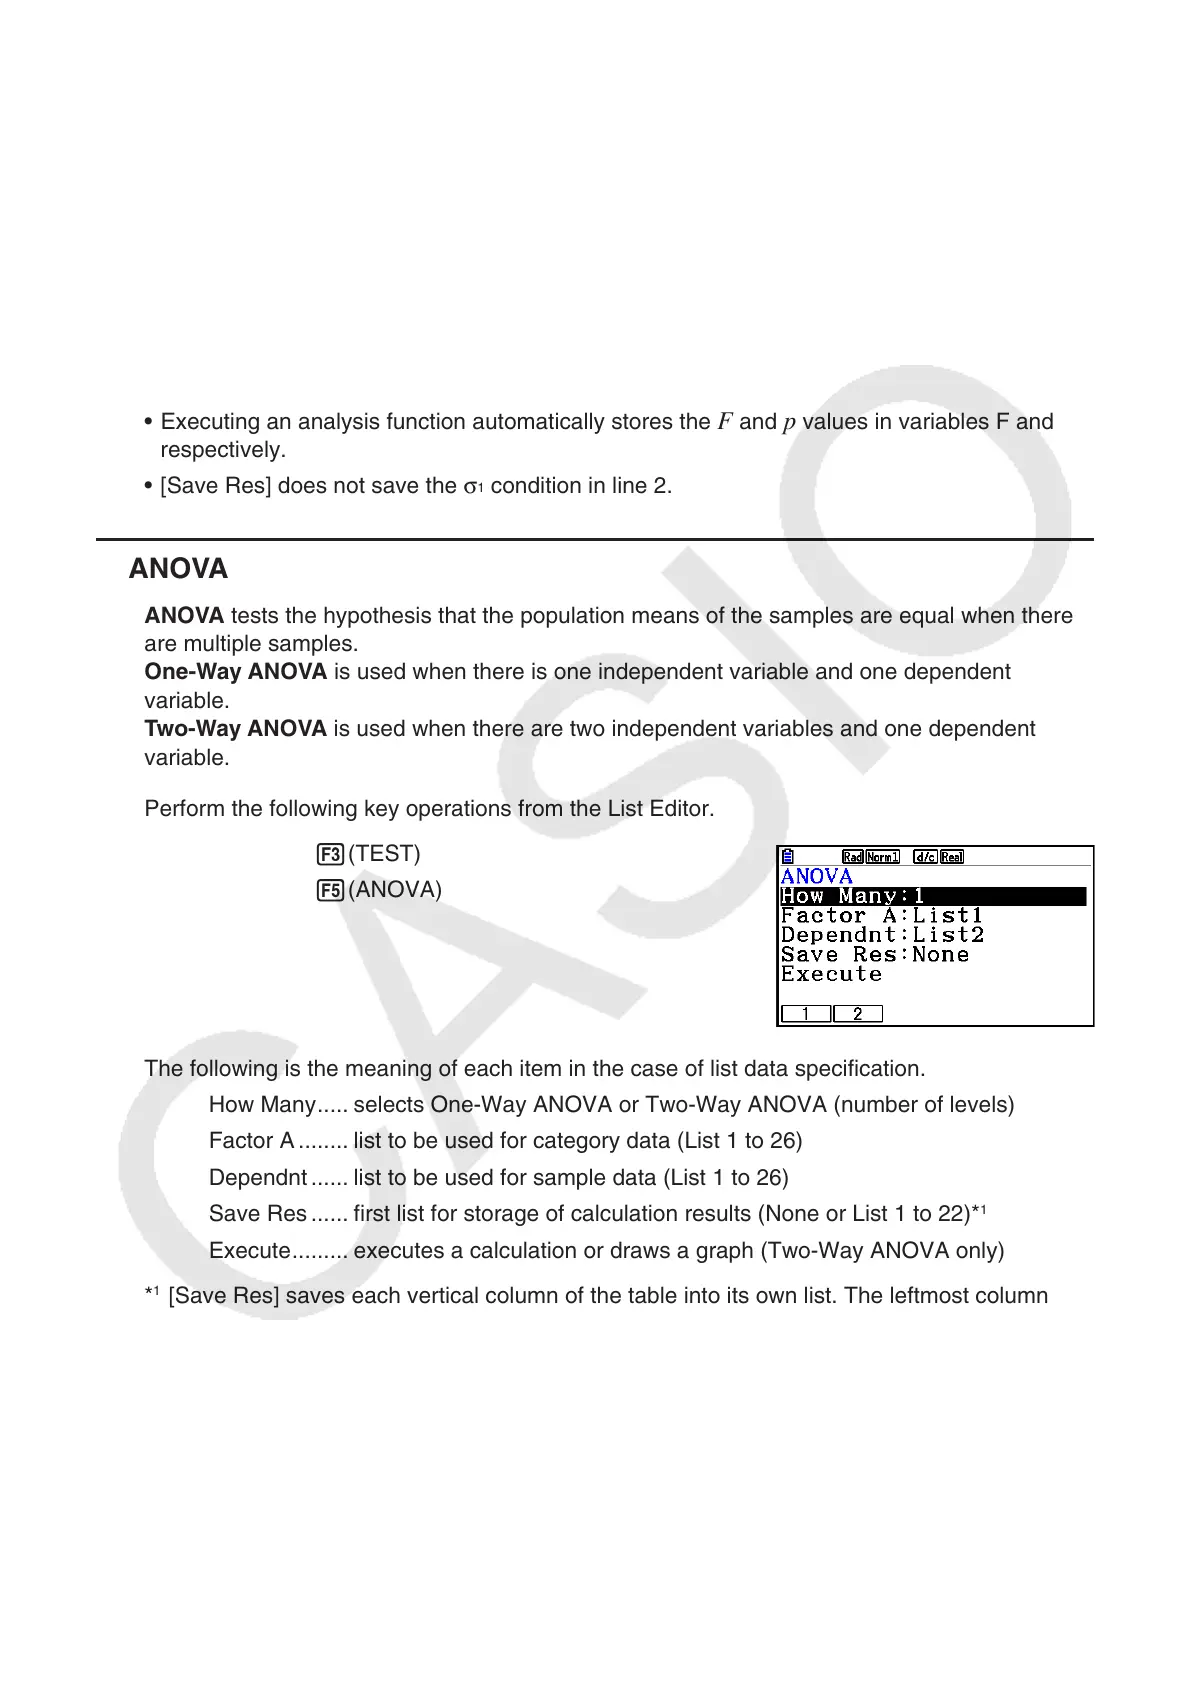
Perform the following key operations from the List Editor.
3(TEST)
5(ANOVA)
The following is the meaning of each item in the case of list data specification.
How Many ..... selects One-Way ANOVA or Two-Way ANOVA (number of levels)
Factor A ........ list to be used for category data (List 1 to 26)
Dependnt ...... list to be used for sample data (List 1 to 26)
Save Res ...... first list for storage of calculation results (None or List 1 to 22)*
1
Execute ......... executes a calculation or draws a graph (Two-Way ANOVA only)
*
1
[Save Res] saves each vertical column of the table into its own list. The leftmost column
is saved in the specified list, and each subsequent column to the right is saved in the next
sequentially numbered list. Up to five lists can be used for storing columns. You can specify
an first list number in the range of 1 to 22.
The following item appears in the case of Two-Way ANOVA only.
Factor B ........ list to be used for category data (List 1 to 26)
GphColor ...... specifies the graph line color (page 6-34)