15-11
3. Press the function key that corresponds to the type of regression calculation*
1
you want to
perform.
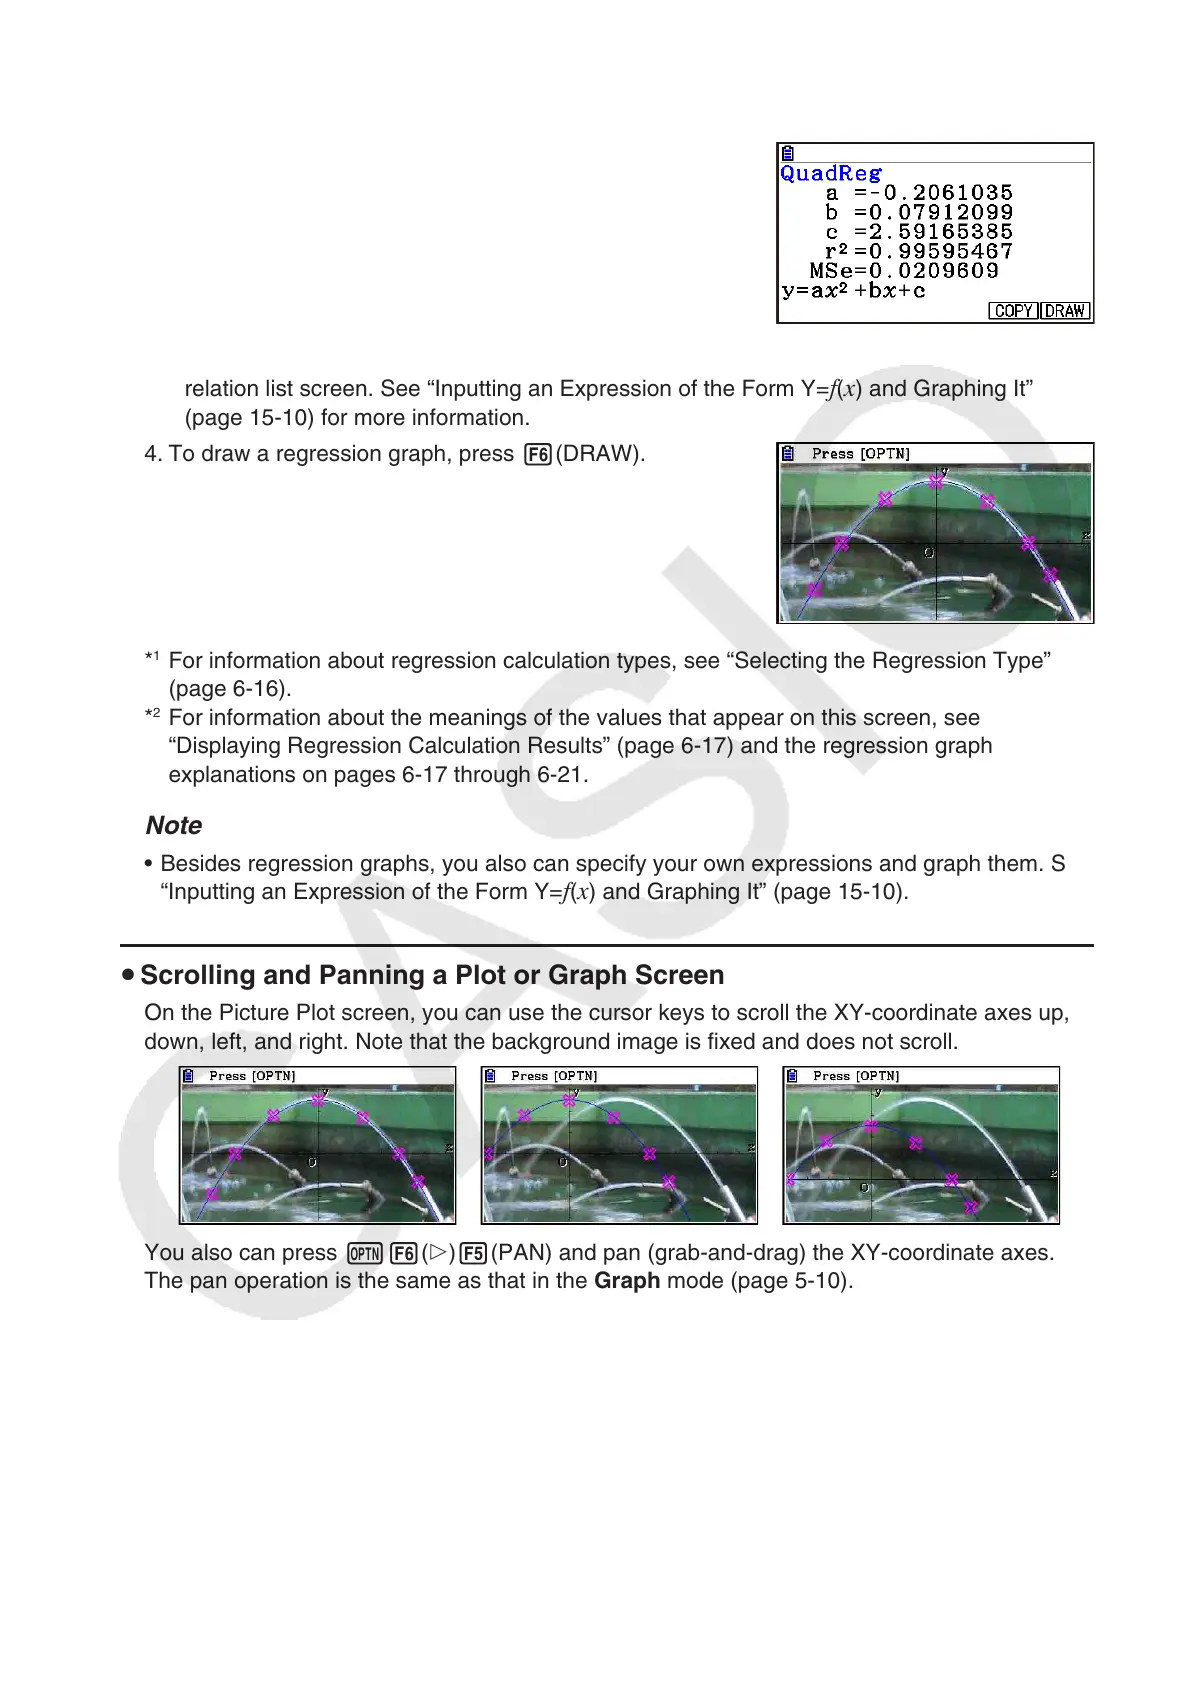
• To perform quadratic regression, for example, press
3(X
2
). This performs the regression calculation and
displays the results.*
2
• You can press 5(COPY) here to copy the obtained regression formula to the graph
relation list screen. See “Inputting an Expression of the Form Y=f(x) and Graphing It”
(page 15-10) for more information.
4. To draw a regression graph, press 6(DRAW).
*
1
For information about regression calculation types, see “Selecting the Regression Type”
(page 6-16).
*
2
For information about the meanings of the values that appear on this screen, see
“Displaying Regression Calculation Results” (page 6-17) and the regression graph
explanations on pages 6-17 through 6-21.
Note
• Besides regression graphs, you also can specify your own expressions and graph them. See
“Inputting an Expression of the Form Y=f(x) and Graphing It” (page 15-10).
u Scrolling and Panning a Plot or Graph Screen
On the Picture Plot screen, you can use the cursor keys to scroll the XY-coordinate axes up,
down, left, and right. Note that the background image is fixed and does not scroll.
You also can press K6(g)5(PAN) and pan (grab-and-drag) the XY-coordinate axes.
The pan operation is the same as that in the Graph mode (page 5-10).