Chapter 4 Monitoring
Check the Dashboard
4-8
User Guide for the Catalyst Express 500 Switches
OL-8122-01
View the Alert Log for the details of the problems and the most recent time at
which the switch detected the problems. For information about the log, see the
“Check the Alert Log” section on page 4-23.
Check the Dashboard
The Dashboard (Figure 4-4) is the main window for monitoring the switch status
and performance. It is the default window and appears each time you display the
device manager. To display the Dashboard, choose Dashboard from the device
manager menu.
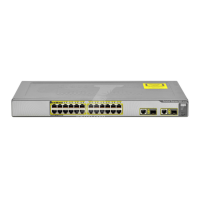
Figure 4-4 Switch Dashboard
The Dashboard displays:
• “Switch Information” section on page 4-9
• “Bandwidth Used Gauge” section on page 4-10
• “Packet Error Gauge” section on page 4-11