Send documentation comments to mdsfeedback-doc@cisco.com
Fabric Manager Client Quick Tour
A-2
Cisco MDS 9000 Family Fabric Manager Quick Configuration Guide
OL-7765-02
Fabric Manager Client Quick Tour
This section helps you get familiar with the various icons and sections that enable navigation in the
Fabric Manager Client interface, as shown in Figure A-1.
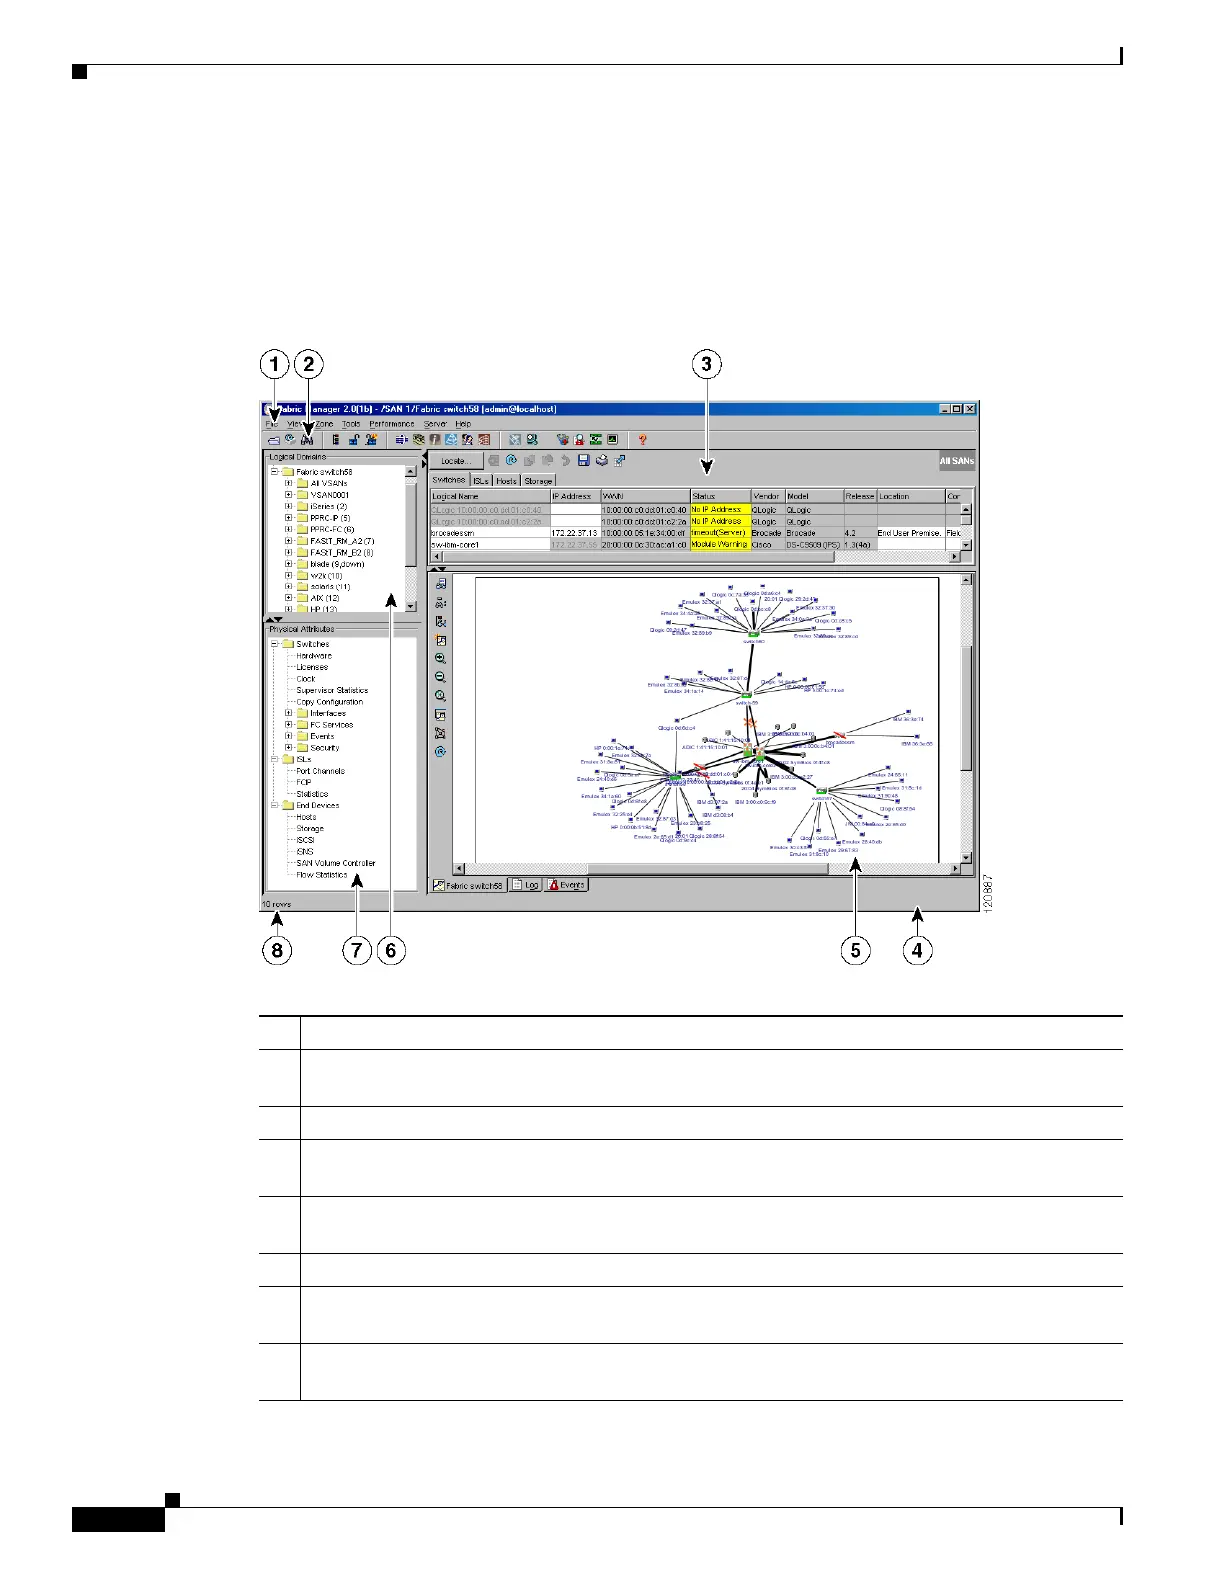
Figure A-1 Fabric Manager Main Window
1 Menu bar—Provides access to options that are organized by menus.
2 Toolbar—Provides icons to access the most commonly used options on the File, Tools, and Help
menus.
3 Information pane—Displays information about whatever option is selected in the menu tree.
4 Status bar (right side)—Shows the last entry displayed by the discovery process, and the possible
error message.
5 Fabric pane—Displays a map of the network fabric, including switches, hosts, and storage. It also
provides tabs for displaying log and event data.
6 Logical domains—Displays a tree of configured SANs, fabrics, VSANs, and zones.
7 Physical attributes—Displays a tree of available configuration tasks depending on the SAN,
fabric, VSAN, or zone selected above. Lists the switches and end devices in the logical selection.
8 Status Bar (left side)—Shows short-term transient messages, such as the number of rows
displayed in a table.
 Loading...