31
Flow rate sensor selection method
1
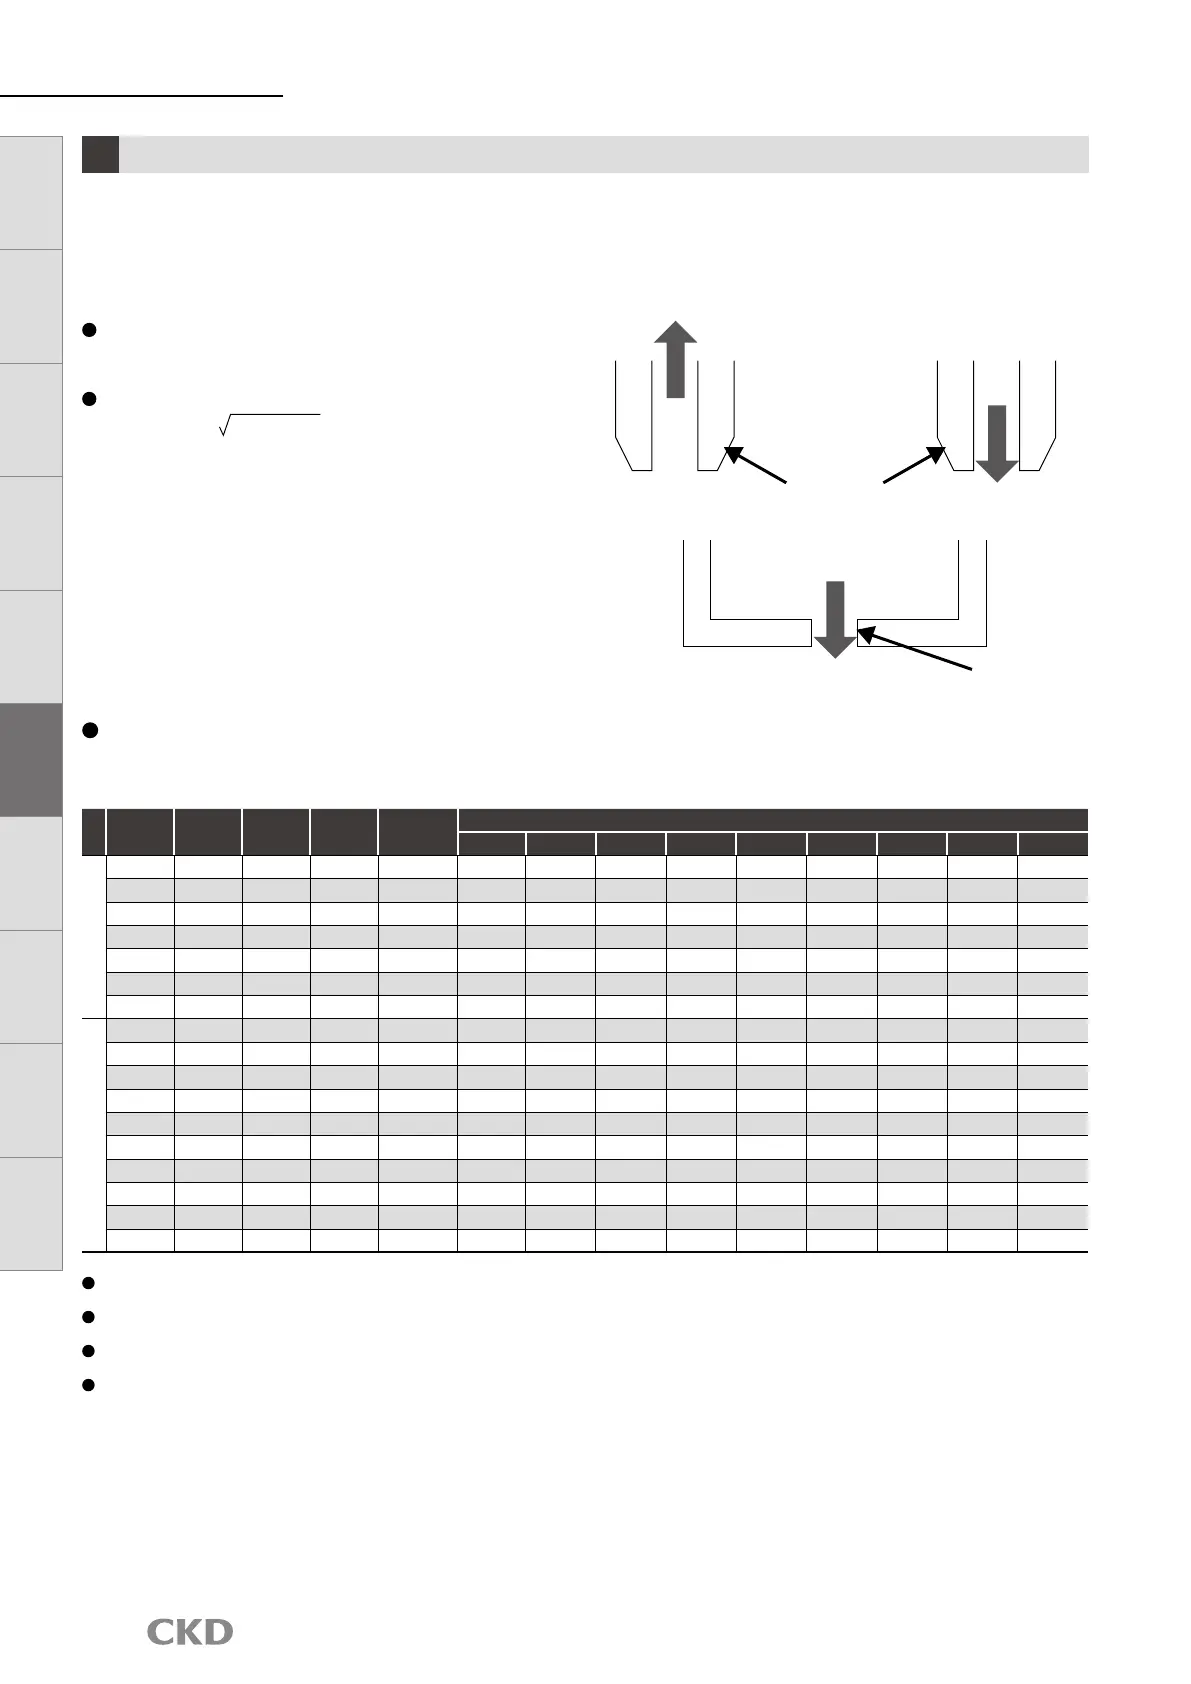
Use as a guide for selection of the flow rate range when using the flow rate sensor for suction/unload confirmation or leakage
inspection, etc., with the suction nozzle.
The flow rate can be calculated using the effective cross-sectional area of nozzle (pinhole) and the pressure difference inside and
outside of nozzle.
For P1 ≥ 1.89P
2
(acoustic velocity)
Q = 113.2 × S × P
1
For P1 < 1.89P
2
(subsonic velocity)
Q : Flow rate ℓ/min
P
1
: Primary side absolute pressure MPa
P
2
: Secondary side absolute pressure MPa
S : Effective cross-sectional area of nozzle (pinhole) mm
2
Example of calculation
The figure below shows the calculated value of flow rate when the nozzle diameter is φ0.1 to φ2 and P2 is varied.
P
1
(MPa)
Absolute
pressure
P
1
(MPa)
Gauge
pressure
P
2
(MPa)
Absolute
pressure
P
2
(MPa)
Gauge
pressure
Acoustic velocity/
subsonic velocity
Calculated flow rate value (ℓ/min)
φ0.1 φ0.2 φ0.3 φ0.4 φ0.5 φ0.7 φ1 φ1.5 φ2
Vacuum
0.1013 0 0.0313
-
0.07
Acoustic velocity
0.090 0.360 0.810 1.440 2.250 4.411 9.002 20.254 36.007
0.1013 0 0.0413
-
0.06
Acoustic velocity
0.090 0.360 0.810 1.440 2.250 4.411 9.002 20.254 36.007
0.1013 0 0.0513
-
0.05
Acoustic velocity
0.090 0.360 0.810 1.440 2.250 4.411 9.002 20.254 36.007
0.1013 0 0.0613
-
0.04
Subsonic velocity
0.088 0.352 0.792 1.408 2.200 4.312 8.800 19.801 35.202
0.1013 0 0.0713
-
0.03
Subsonic velocity
0.082 0.329 0.740 1.315 2.055 4.028 8.220 18.494 32.878
0.1013 0 0.0813
-
0.02
Subsonic velocity
0.072 0.287 0.645 1.147 1.792 3.512 7.166 16.125 28.666
0.1013 0 0.0913
-
0.01
Subsonic velocity
0.054 0.215 0.483 0.859 1.343 2.631 5.370 12.083 21.480
Blow (leakage inspection)
0.1113 0.01 0.1013 0
Subsonic velocity
0.057 0.226 0.509 0.905 1.414 2.772 5.657 12.727 22.626
0.1213 0.02 0.1013 0
Subsonic velocity
0.080 0.320 0.720 1.280 2.000 3.920 8.000 17.999 31.998
0.1413 0.04 0.1013 0
Subsonic velocity
0.113 0.453 1.018 1.810 2.828 5.543 11.313 25.454 45.252
0.1613 0.06 0.1013 0
Subsonic velocity
0.139 0.554 1.247 2.217 3.464 6.789 13.856 31.175 55.423
0.1813 0.08 0.1013 0
Subsonic velocity
0.160 0.640 1.440 2.560 4.000 7.840 15.999 35.998 63.996
0.2013 0.1 0.1013 0
Acoustic velocity
0.179 0.716 1.610 2.862 4.472 8.765 17.888 40.248 71.552
0.3013 0.2 0.1013 0
Acoustic velocity
0.268 1.071 2.410 4.284 6.694 13.119 26.774 60.242 107.096
0.4013 0.3 0.1013 0
Acoustic velocity
0.357 1.426 3.209 5.706 8.915 17.474 35.660 80.236 142.641
0.5013 0.4 0.1013 0
Acoustic velocity
0.445 1.782 4.009 7.127 11.137 21.828 44.547 100.230 178.186
0.6013 0.5 0.1013 0
Acoustic velocity
0.534 2.137 4.809 8.549 13.358 26.182 53.433 120.224 213.731
(CAUTION)
When there is a leakage in the piping, etc., the actual flow rate becomes larger than the calculated value. When selecting the flow rate, consider the
amount of leakage in the piping.
When there is a portion narrower than the suction nozzle diameter in the middle of the piping, the flow rate may be reduced to lower than the
calculated value. In addition, suction confirmation, etc., may become impossible.
The effective cross-sectional area is just a guideline. When the nozzle is long and thin, the effective cross-sectional area becomes smaller than the
opening area.
The response time is determined by the inner volume of the piping from the flow rate sensor to suction nozzle (pinhole). For high-speed detection,
reduce the inner volume of the piping as much as possible by installing a flow rate sensor near the suction nozzle, etc.
FSM3
Series
Q = 226.4 × S × P
2
(P1 − P
2
)
P
2
: Vacuum
Suction nozzle
Pinhole
P
1
: Atmospheric pressure
P
1
: Pressurization
P
1
: Pressurization
P
2
: Atmospheric pressure
P
2
: Atmospheric pressure
LCD displayBar display
IO-Link
Internal
structure
Separate
display
Technical
data
Operating
method
Optional
products
Safety
precautions
Related
products
 Loading...