17
ENGLISH
Max/min
1. In normal display mode, press once on [ MAX/MIN/ALARM ]. MAXwill appear
on thedisplay and themaximum recorded readings of therainfall, wind speed,
atmospheric pressure, temperature and humidity will beshown.
2. Press [ MAX/MIN/ALARM ] oncemore. MINwill appear on thedisplay and
theminimum recorded readings of therainfall, wind speed, atmospheric pressure,
temperature and humidity will beshown.
Pressing [ HISTORY/- ] while in max/min display mode will toggle between displaying
thereadings for therainfall and theatmospheric pressure.
Clearing recorded readings
Note:
Clearing thesaved max/min readings sets thereadings of all thesensors tozero.
1. In normal mode, press [ MAX/MIN/ALARM ] repeatedly to select MAX orMIN.
2. Hold in [ MODE/SET ] for 3 seconds (CLR will flash) to clear themax and min
readings respectively.
For automatic clearing of max/min readings every night at midnight, refer to
theSettings/adjustments (CLR) section.
Rainfall
1. In normal display mode, press [ MODE/SET ] twice to select thedisplay mode for rainfall.
2. Press repeatedly on [ CHANNEL/+ ] or [ HISTORY/- ] to select thedisplaymode.
3. Hold in [ MODE/SET ] for 3 seconds to clear theselected reading.
Memory
To clear thememory of theweather station, refer to theSoftware (WeatherHome) section.
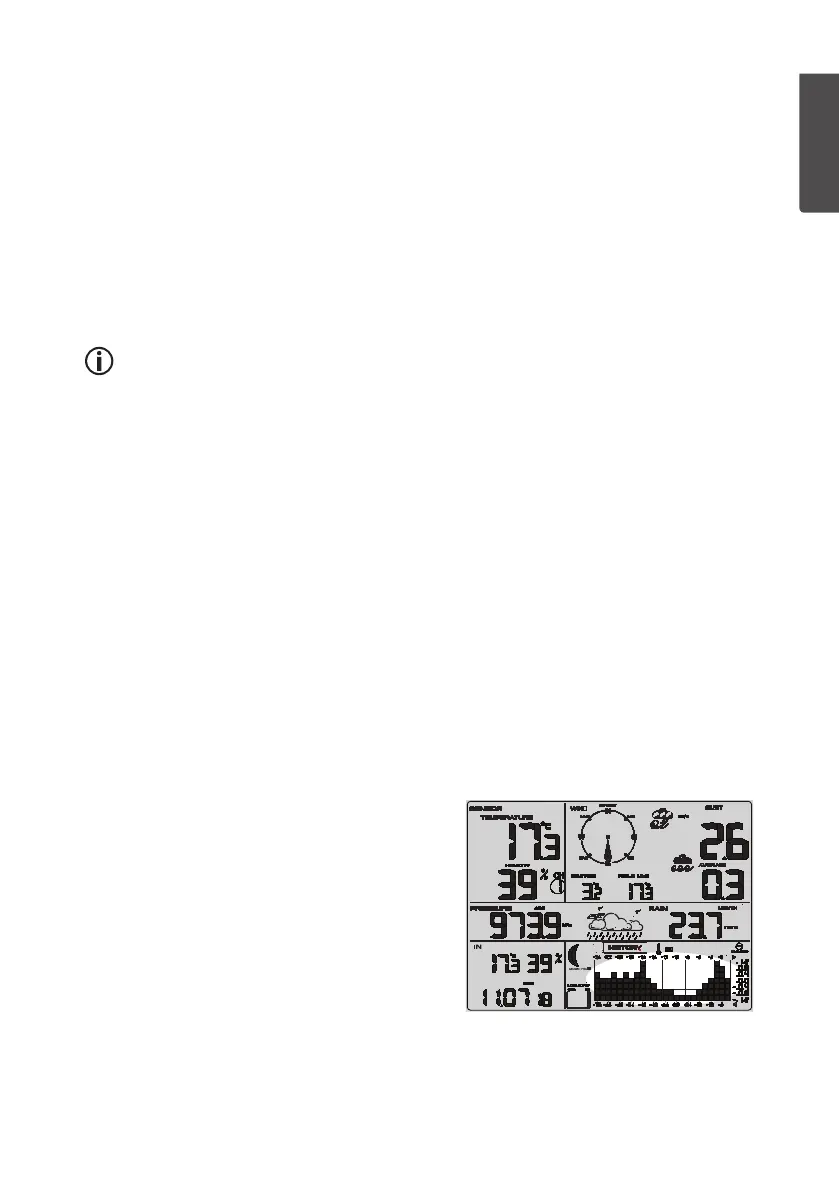
Histogram, weather forecast and moon phase
Histogram
The weather station can display data recorded
24 or 72 hours back intime. Referto
theChanging thedisplay mode for thetime/
date and weather data section.
The vertical axis of thegraph shows thechanges
in themeasured data over time compared
with thecurrent reading. Thecurrent reading
(thecolumn furthest to theright) always
displays0.
E.g. whenlooking at atemperature histogram:
If thecolumn shows0.4 it represents a
historical temperature0.4 degrees higher
than thecurrent temperature.