Previous Page: Go back to the Statistics main page.
Refresh: To renew the details collected and displayed.
Clear Counter: To reset the details displayed.
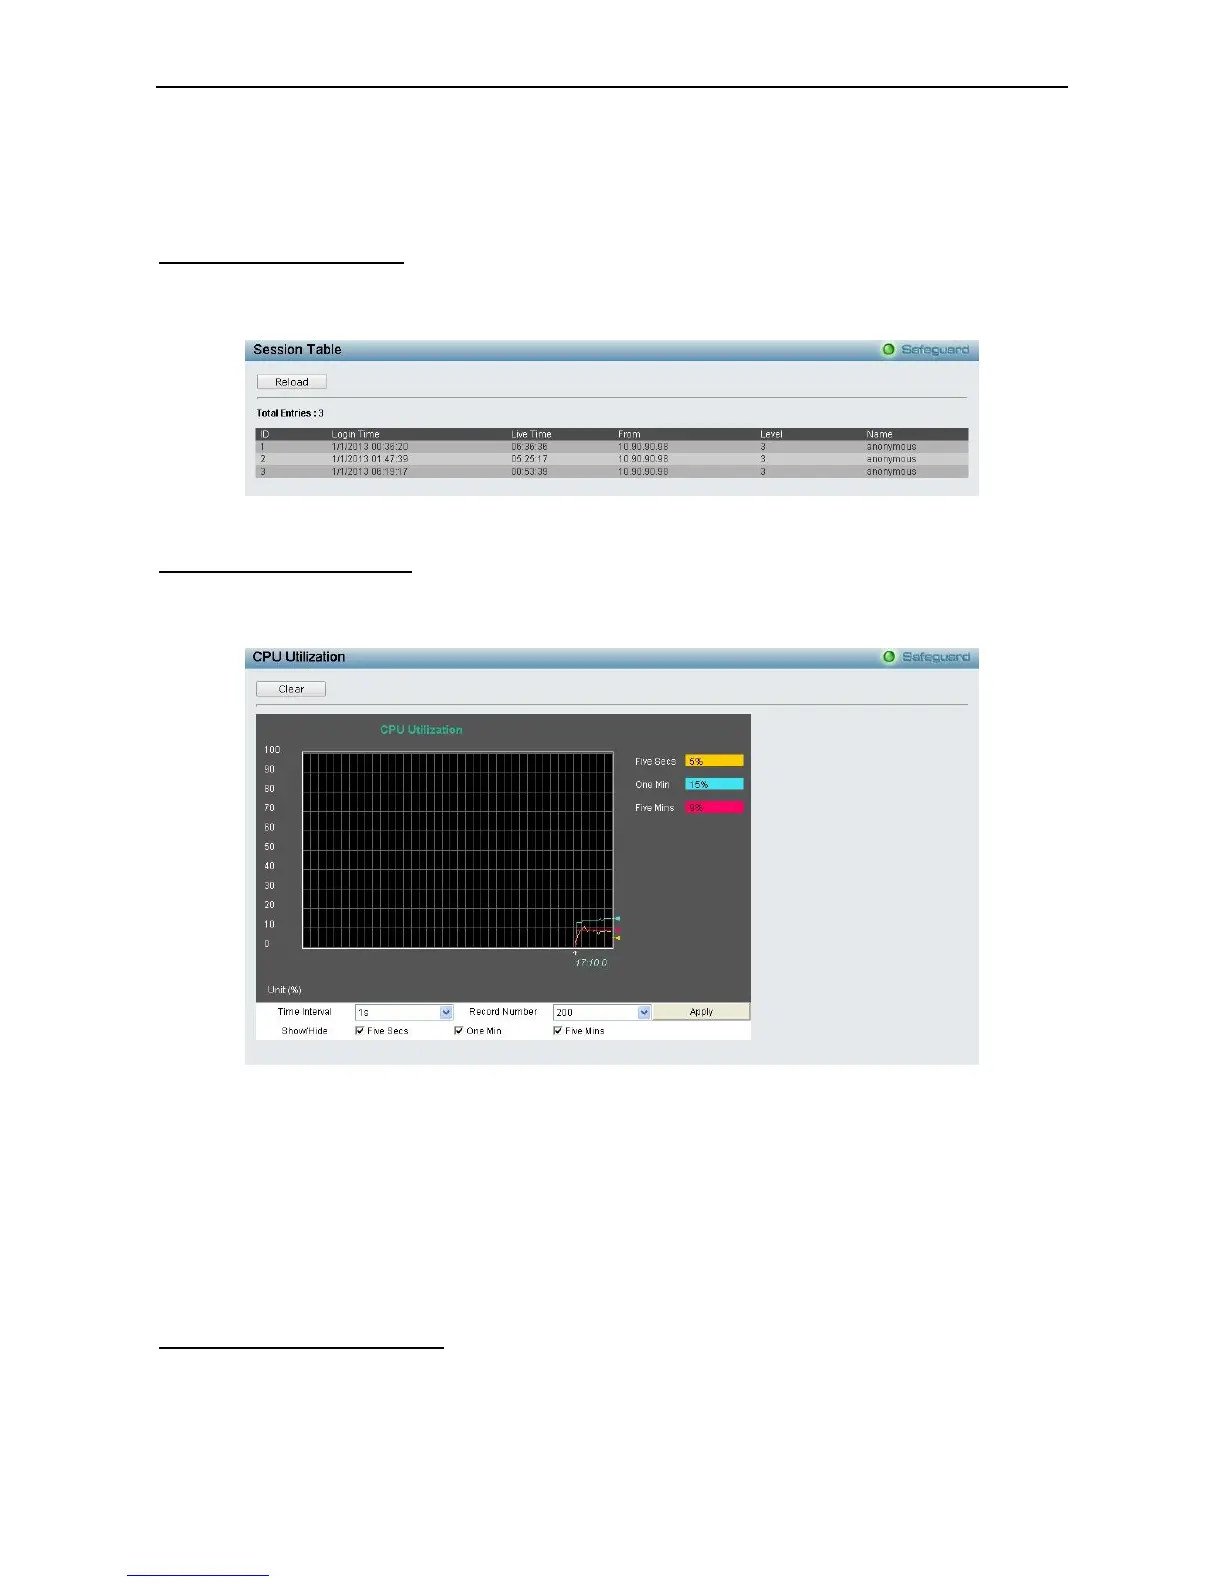
Monitoring > Session Table
The Session Table allows you to view detailed information on the current configuration session of the Switch.
Information such as the Session ID of the user, initial Login Time, Live Time, configuration connection
From the Switch, Level and Name of the user are displayed. Click Reload to refresh this window.
Figure 4.112 – Monitoring > Session Table
Monitoring > CPU Utilization
The CPU Utilization displays the percentage of the CPU being used, expressed as an integer percentage
and calculated as a simple average by time interval. Click Apply to implement the configured settings. The
window will automatically refresh with new updated statistics.
Figure4.113 – Monitoring > CPU Utilization
The information is described as follows:
Time Interval: Select the desired setting between 1s and 60s, where "s" stands for seconds. The default
value is one second.
Record Number: Select the number of times the Switch will be polled between 20 and 200. The default
value is 200.
Show/Hide: Check whether to display Five Secs, One Min, and/or Five Mins.
Clear: Click to clear all statistics counters in this window.
Monitoring > Memory Utilization
The Memory Utilization displays the percentage of the memory being used, expressed as an integer
percentage and calculated as a simple average by time interval. Click Apply to implement the configured
settings. The window will automatically refresh with new updated statistics.
 Loading...