The following fields can be set or viewed:
Time Interval: Select the desired setting between 1s and 60s, where “s” stands for seconds. The default
value is one second.
Record Number: Select the number of times the Switch will be polled between 20 and 200. The default
value is 200.
Unicast: Counts the total number of good packets that were received by a unicast address.
Multicast: Counts the total number of good packets that were received by a multicast address.
Broadcast: Counts the total number of good packets that were received by a broadcast address.
Show/Hide: Check whether or not to display Multicast, Broadcast and Unicast packets.
Clear: Click to clear all statistic counters on this window.
View Table: Click to display a table rather than a line graph.
View Line Chart: Click to display a line graph rather than a table.
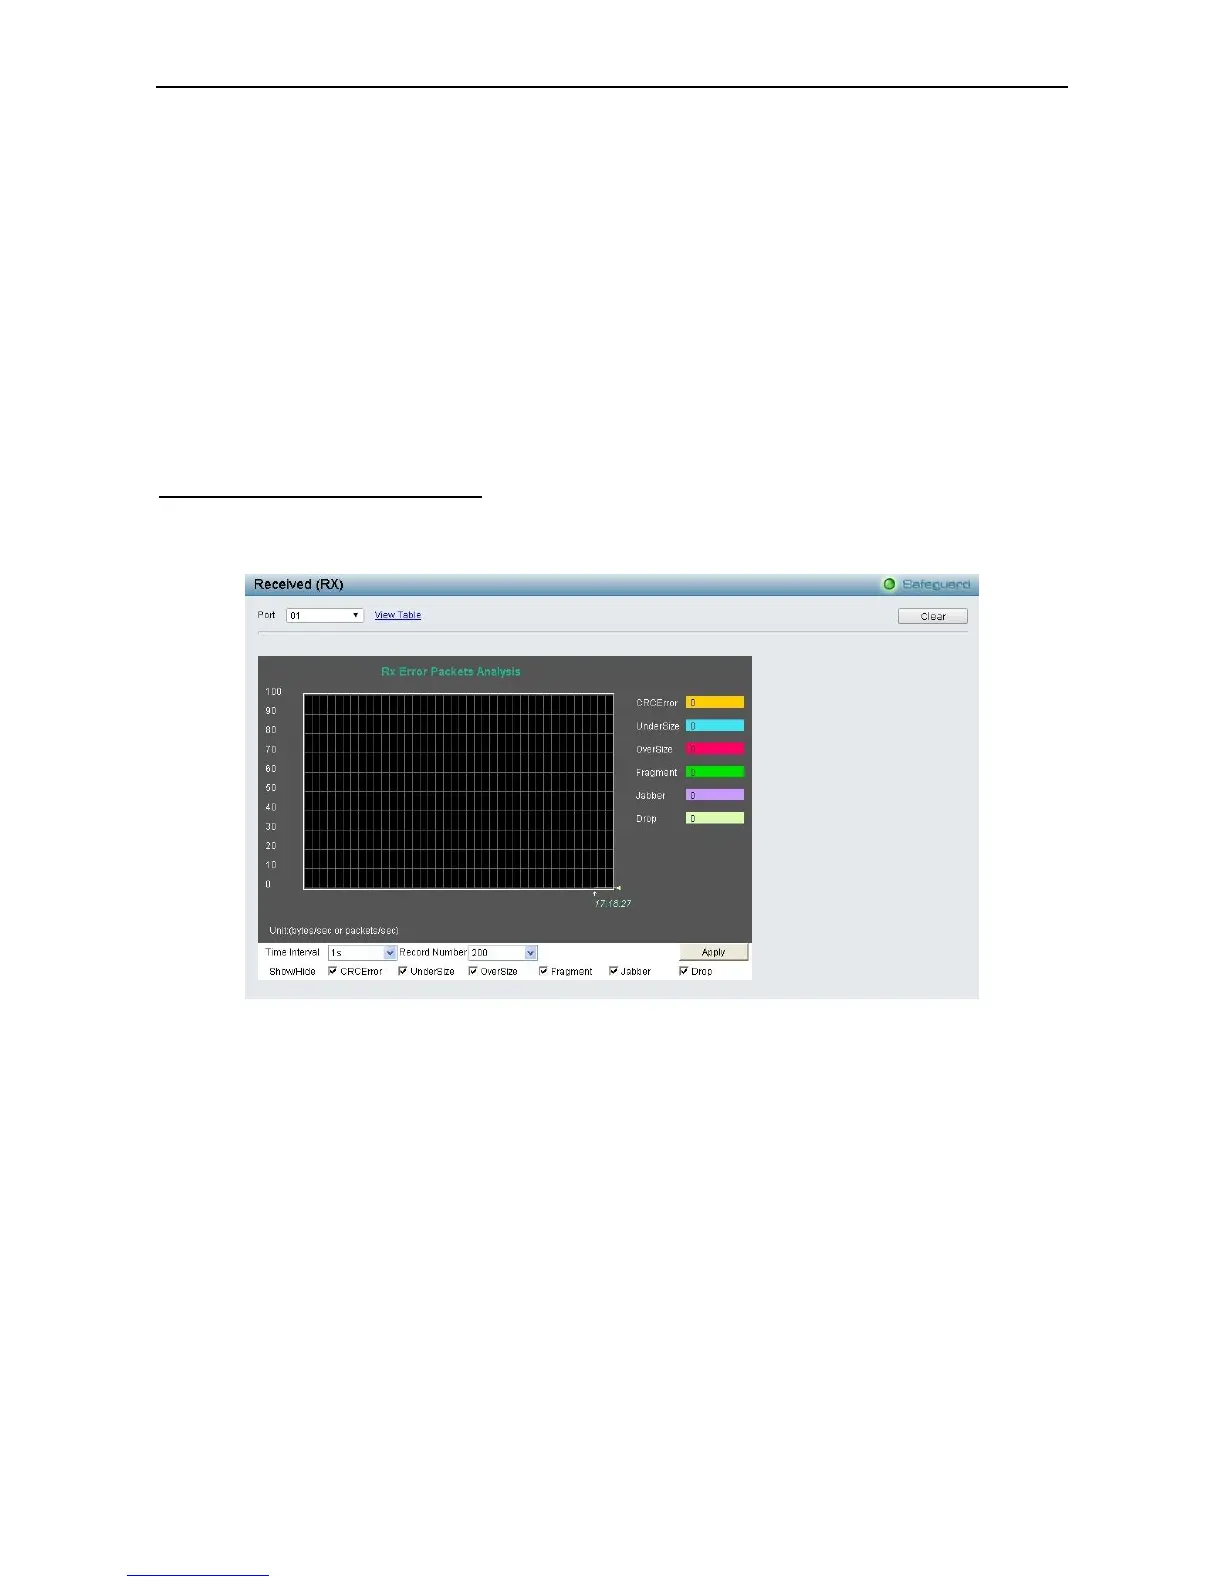
Monitoring > Errors > Received (RX)
This page displays the following graph of error packets received on the Switch. To select a port to view these
statistics for, select the port by using the Port drop-down menu. You may also use the real-time graphic of
the Switch at the top of the web page by simply clicking on a port.
Figure4.124 - Monitoring > Errors > Received (RX) (line graph)
To view the Received Error Packets Table, click the link View Table, which will show the following table:
 Loading...