Cell Size Gating
• Use the on-screen sliders to adjust the size range of interest for the current sample. Cell
outlines and count results are updated in real time. Gate to exclude debris or alternative cell
populations from analysis. Press the Histogram button to graphically view cell size
distribution and apply gating. Press Apply Gating to Result to update and save the result.
Intensity Gating (GFP app only)
• In the GFP app, users may gate cells by size as well as intensity. Use the on-screen slider to
adjust the intensity gating from 0-100. The higher the number, the higher the intensity must be
for a cell to be included in the counted result. The intensity gating icon will open a graph
showing the intensity profile of the cell population.
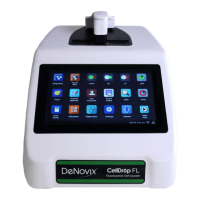
Result Overlay Selector
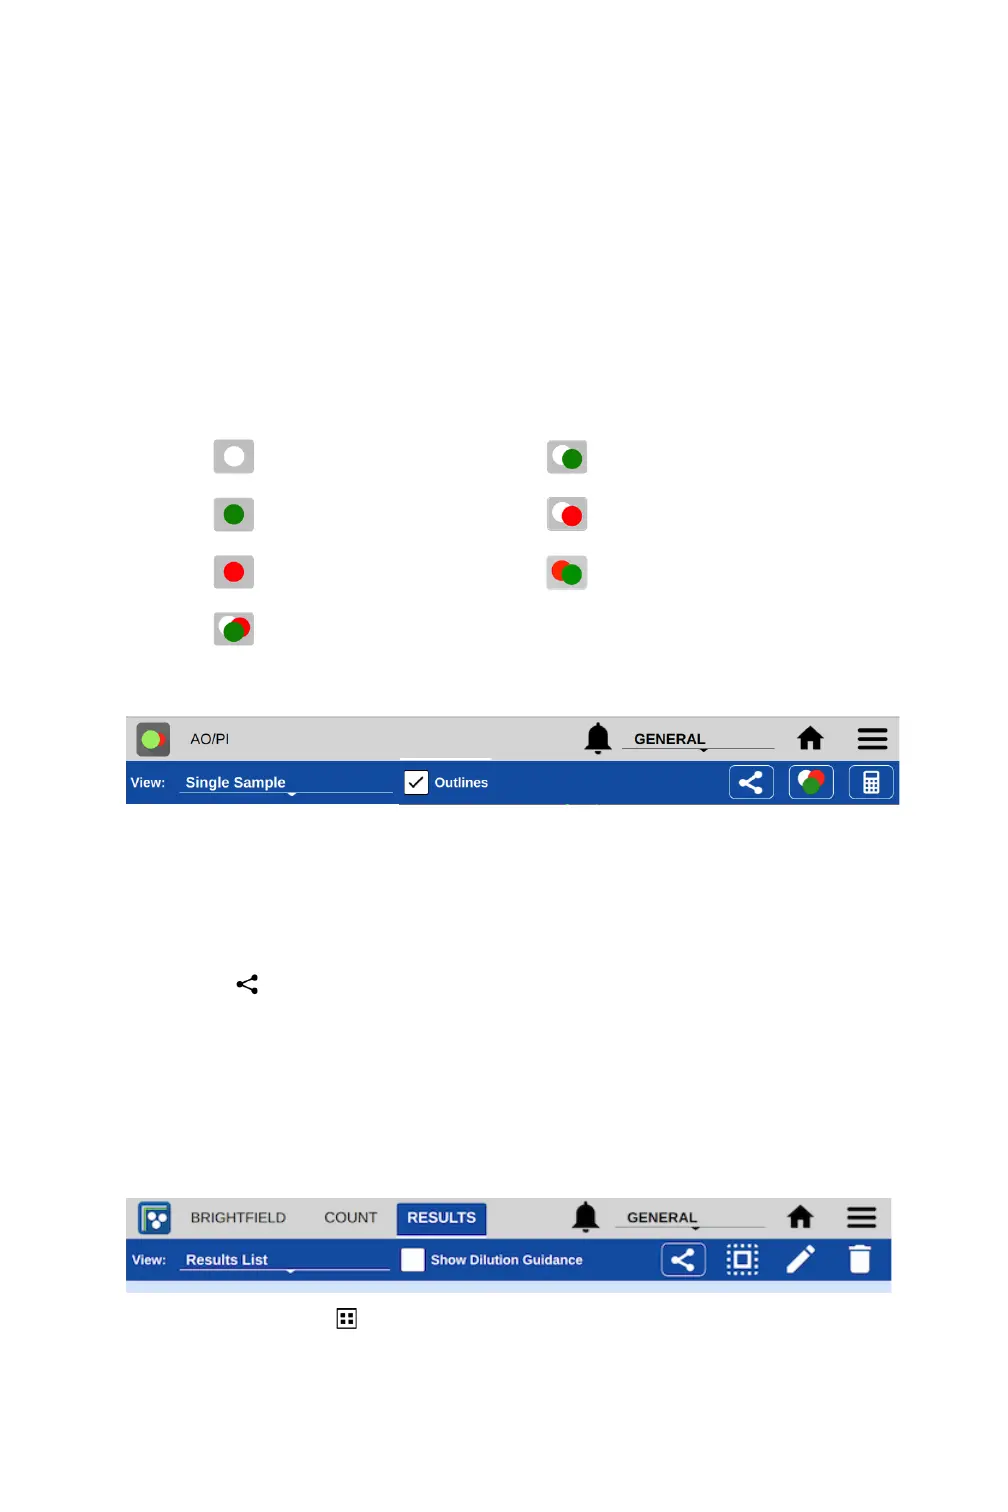
Action Bar Controls
• View Selector: Use this drop down to access the various Results tab views including viewing a
list of multiple results. The Default selection is Single Sample view.
• Outlines: The checkbox is used to toggle on/off the outlines for counted cells for views that
include cell images.
• Export : Export results in .csv, .pdf, or .png formats via USB, Email and Network Printer.
• Image Selector: This icon indicates the overlaid images included in the result being viewed.
Tap the icon to change the overlay combination for the current sample or after optimizing
settings for a previous result.
• Calculator: Access the Dilution Calculator.
Additional Action Bar Controls
• Select/Deselect All : These icons enable all items in a list to be selected or deselected with
one tap of the icon.