132 | Dexcom G4 Continuous Glucose Monitoring System
11
Overall, the System reads, on average, 8.2% different (Mean Percent
Difference) than the YSI at glucose levels of 40-400 mg/dL (2.2-22.2 mmol/L)
and, 14.1% absolute different (Mean Absolute Difference) than the YSI values
at glucose levels of 40-400 mg/dL (2.2-22.2 mmol/L). The Median Percent
Difference shows that 50% of the time the System reads approximately 8.7%
more than the YSI blood glucose values and the Median Absolute Difference
shows that 50% of the time the System reads about 12.0% different than YSI
blood glucose values.
Clarke Error Grid Analyses
The Clarke Error Grid was used to determine if System results are “clinically
accurate.” The Clarke Error Grid divides a correlation plot into 5 zones, which
are described in Table 3.
Results in zones A and B are considered “clinically acceptable,” in that you
would most likely make accurate treatment decisions or decide not to treat with
the readings provided. Results in zones C, D, and E can lead to dangerous
treatment errors. The Clarke Error Grid zones are labeled on a correlation plot in
Figure 1. Each YSI result (horizontal axis) is matched up with its corresponding
System result (vertical axis). A point is recorded where the two readings
intersect. These results are based on 1477 paired data points recorded.
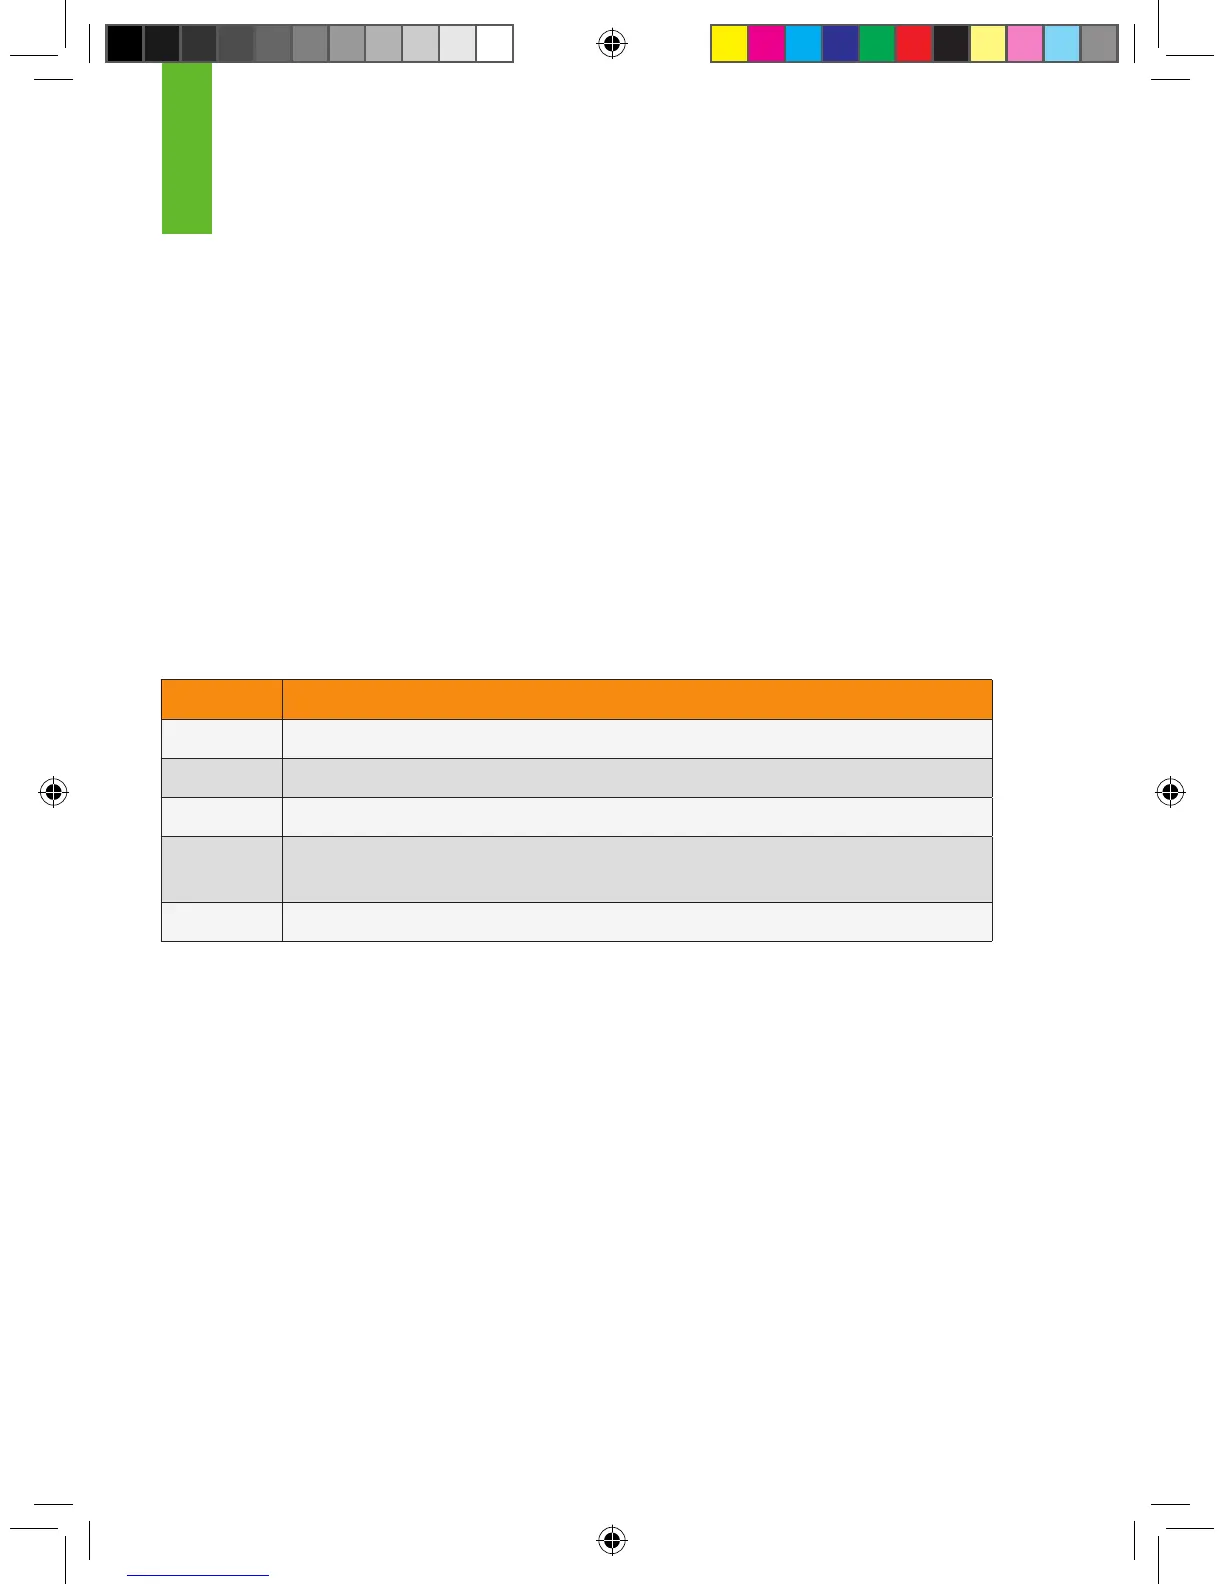
Table 3. Clarke Error Grid Description
Zone Description
A Clinically Accurate, would lead to correct treatment decisions
B Would lead to benign decisions or no treatment
C Would lead to overcorrection of normal glucose levels
D Would lead to failure to be aware of and treatment of high or low glucose
levels
E Would lead to inaccurate and “dangerous” treatment decisions