Dexcom G4 User’s Guide | 133
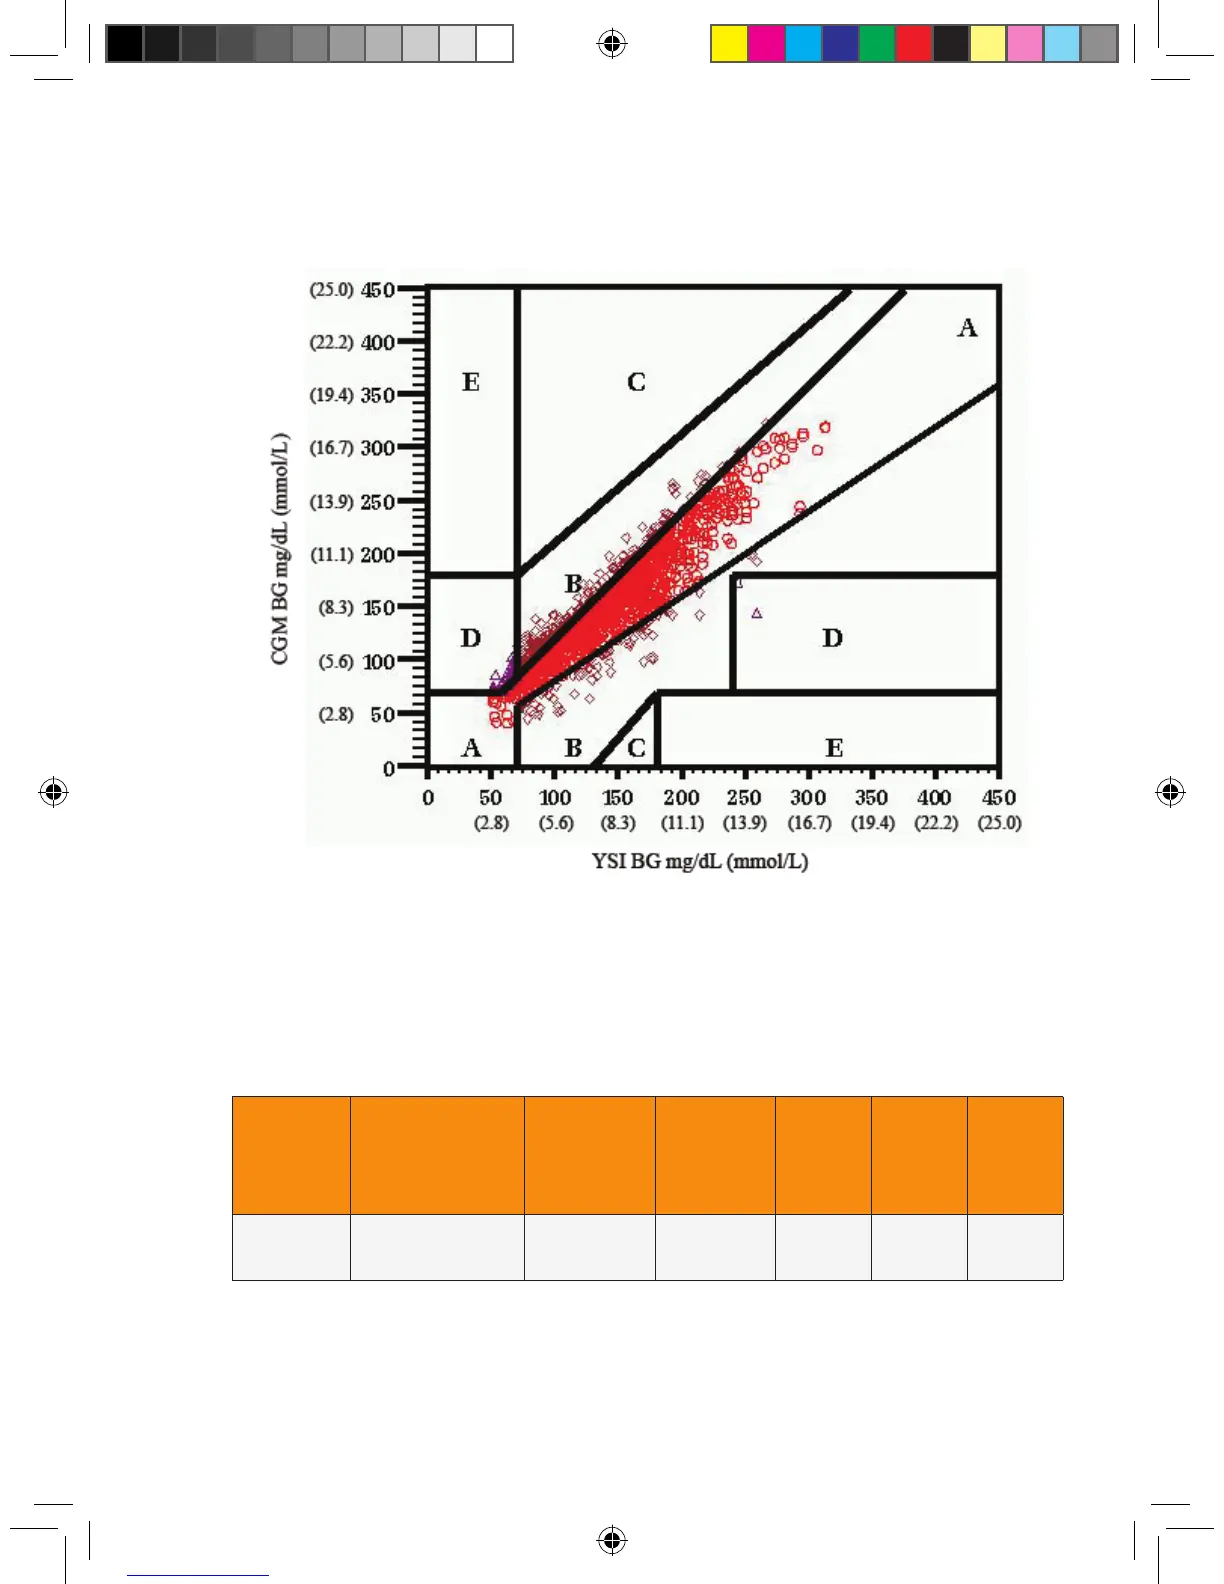
Figure 1. Clarke Error Grid, System Results Compared to YSI Results
Table 4. Clarke Error Grid Analysis
Glucose
Range
mg/dL
(mmol/L)
Total YSI-CGM
Pairs
A
N (%)
B
N (%)
C
N (%)
D
N (%)
E
N (%)
40-400
(2.2-22.2)
1477 1151 (77.9) 285 (19.3) 0 (0.0) 41 (2.8) 0 (0.0)
Summary Statistics (N,%) of System results in Figure 1 are presented in Table 4
according to the percentage of points falling within each zone (A-E).