Dexcom ONE User Guide
18
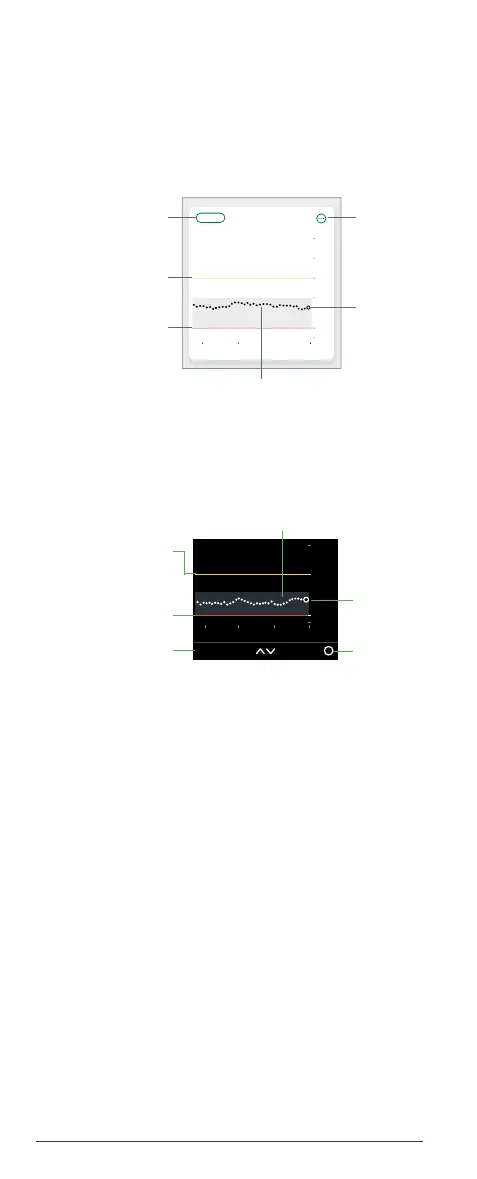
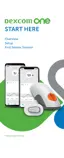
Display device screens
Trend graph
The trend graph displays current and past readings
and shows your alert levels when alerts are turned
on.
App
Receiver
• Current and past sensor readings: The larger
dot on the right is your current reading. The
smaller dots to the left are your past readings.
• High and Low Alert levels: When alerts are on,
they appear as lines on your trend graph. Low is
red. High is yellow.
• Target range: The gray box shows the
fixed target range of 3.9-10.0 mmol/L, the
international consensus for the recommended
target range.
Now11:0010:009:00
2
3.9
14.0
22
18
10
3 Hours612 24
Hours Shown
Current
Sensor
Alert
settings
High Alert Level
Low Alert Level
Past sensor readings
14.0
2
3.9
22
8:00 Now9:00 10:00
Menu3 Hours
Current
Sensor
Readings
High Alert Level
(when alert is on)
Low Alert Level
(when alert is on)