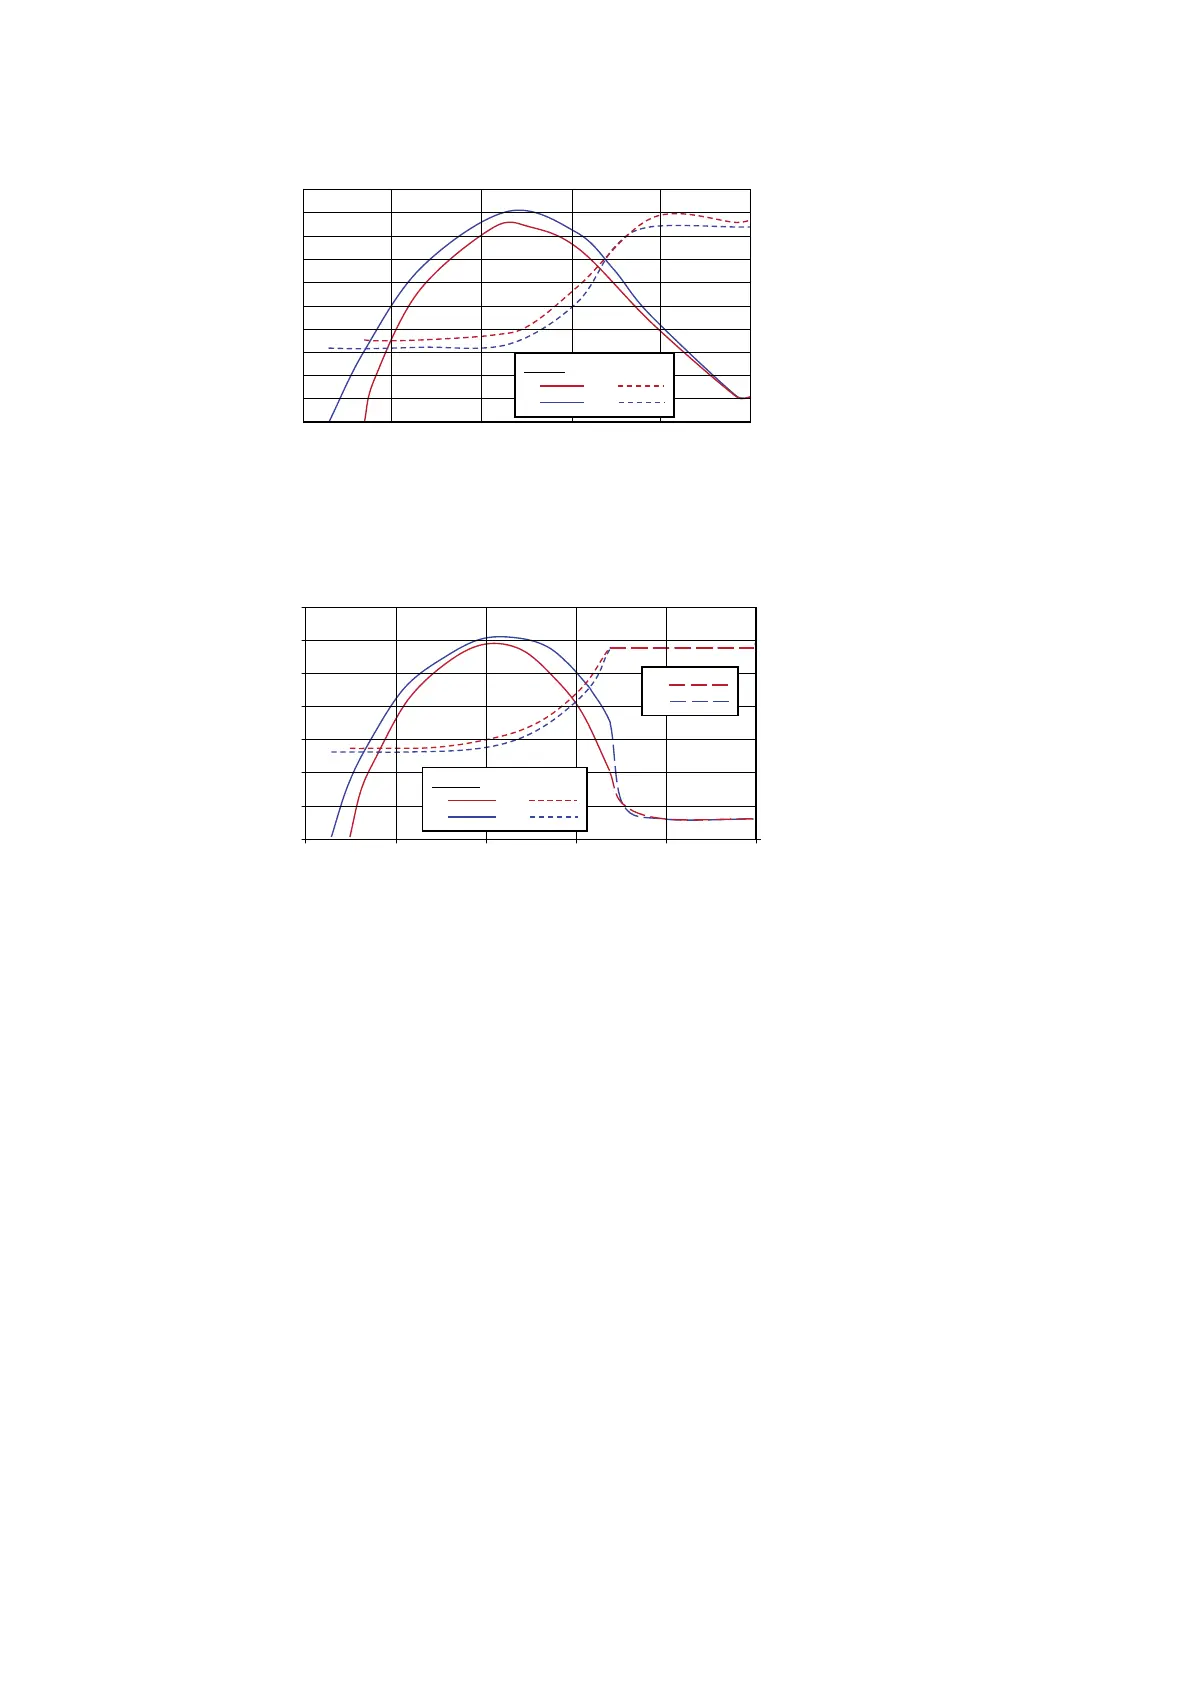
Figure 9 nXR90i performance curve
0.01 0.1 1 10 1000
0
90
10
20
30
50
60
70
80
40
100
100
0
400
800
1200
600
1000
200
1.
2.
nXR90i
3.
4.
Pressure (mbar)
Pumping speed (m
3
h
-1
)
Power consumption (Watt)
1. Pumping speed with gas ballast 2. Pumping speed without gas ballast
3. Power with gas ballast 4. Power without gas ballast
1. Pumping speed with gas ballast 2. Pumping speed without gas ballast
3. Power with gas ballast 4. Power without gas ballast
Figure 10 nXR120i performance curve
0
20
40
60
80
100
120
140
0.01 0.1 1 10 100 1000
0
400
800
1200
600
1000
200
1.
2.
nXR120i
3.
4.
5.
6.
Pressure (mbar)
Pumping speed (m
3
h
-1
)
Power consumption (Watt)
1. Pumping speed with gas ballast 2. Pumping speed without gas ballast
3. Power with gas ballast 4. Power without gas ballast
5. Non-connuous speed with gas ballas
t 6. Non-connuous speed without gas
ballast
1. Pumping speed with gas ballast 2. Pumping speed without gas ballast
3. Power with gas ballast 4. Power without gas ballast
5. Non-connuous speed with gas ballast 6. Non-connuous speed without gas
ballast
3.3 Materials exposed to gases pumped
The materials and the components exposed to the gases in the pump are:
▪ Iron
▪ Aluminium alloy
▪ Steel
▪ Fluoroelastomer (seals)
▪ PFPE lubricant
3.4 Electrical data
If the pump is operang with a supply voltage below the nominal operang range,
example < 200 V in high voltage regions or < 100 V in low voltage regions, the product
will limit the maximum power deliverable to the pump motor. If the applicaon load
exceeds the maximum power available, pump rotaonal speed will be reduced. Refer to
Figure: Speed vs Power graph. At lower rotaonal speeds pumping performance will be
05/2021 - ©Edwards Limited
Page 17A90301880_C
A90301880_C - Technical data
 Loading...