User Guide
Product: Evolis
A_Evolis Solution GB elancity
Page
/
Date: 03/01/2018
Confidential document, property of ELANCITY. All copies and transfers are unauthorized without prior consent.
The Average Speeds graph includes two averages:
- An ‘average by time period’, which is displayed as a curve on the graph. (1 curve per
direction: ingoing/outgoing).
- An overall average which is displayed in the lower part of the graph (in number format).
(See the image above (1))
The ‘average by time period’ corresponds to the arithmetic average calculated on the speeds
recorded between the start/end dates. They are presented on a default time period of 60
minutes.
The overall average corresponds to the arithmetic average of all the speeds included between
the starting/ending dates on the time period selected. The software sums up all of the recorded
speeds, then divides the result by the number of vehicles measured. The shortcut " Crtl+X "
allows you to export the totality of the measures in a .csv file.
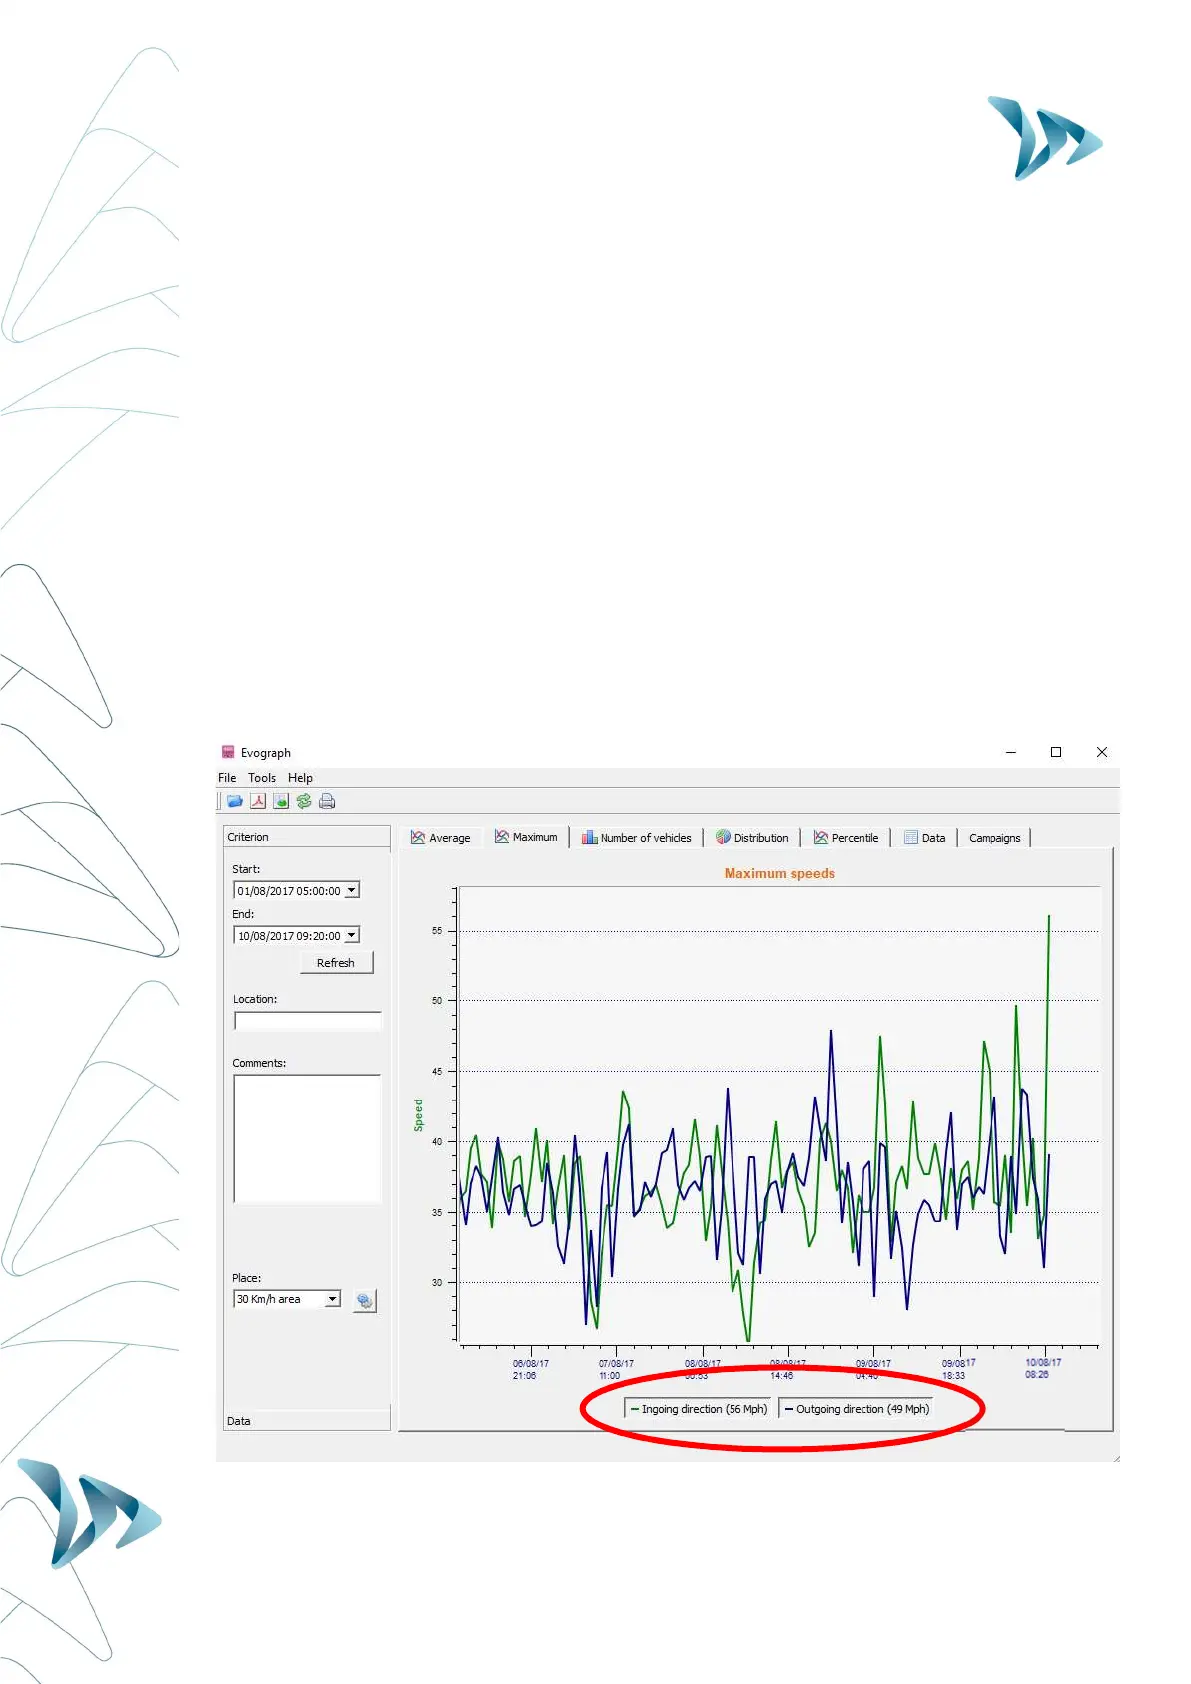
MAXIMUM SPEEDS
(2)