User Guide
Product: Evolis
A_Evolis Solution GB elancity
Page
/
Date: 03/01/2018
Confidential document, property of ELANCITY. All copies and transfers are unauthorized without prior consent.
In the same vein, the images relating to maximum speeds are displayed in curve and number
format.
- The maximum speed recorded recorded per time period are displayed in graph form
(oncoming and outgoing are reflected in different colours).
- The maximum speed recorded over the entire time period is shown at the bottom of
the screen in number form (2).
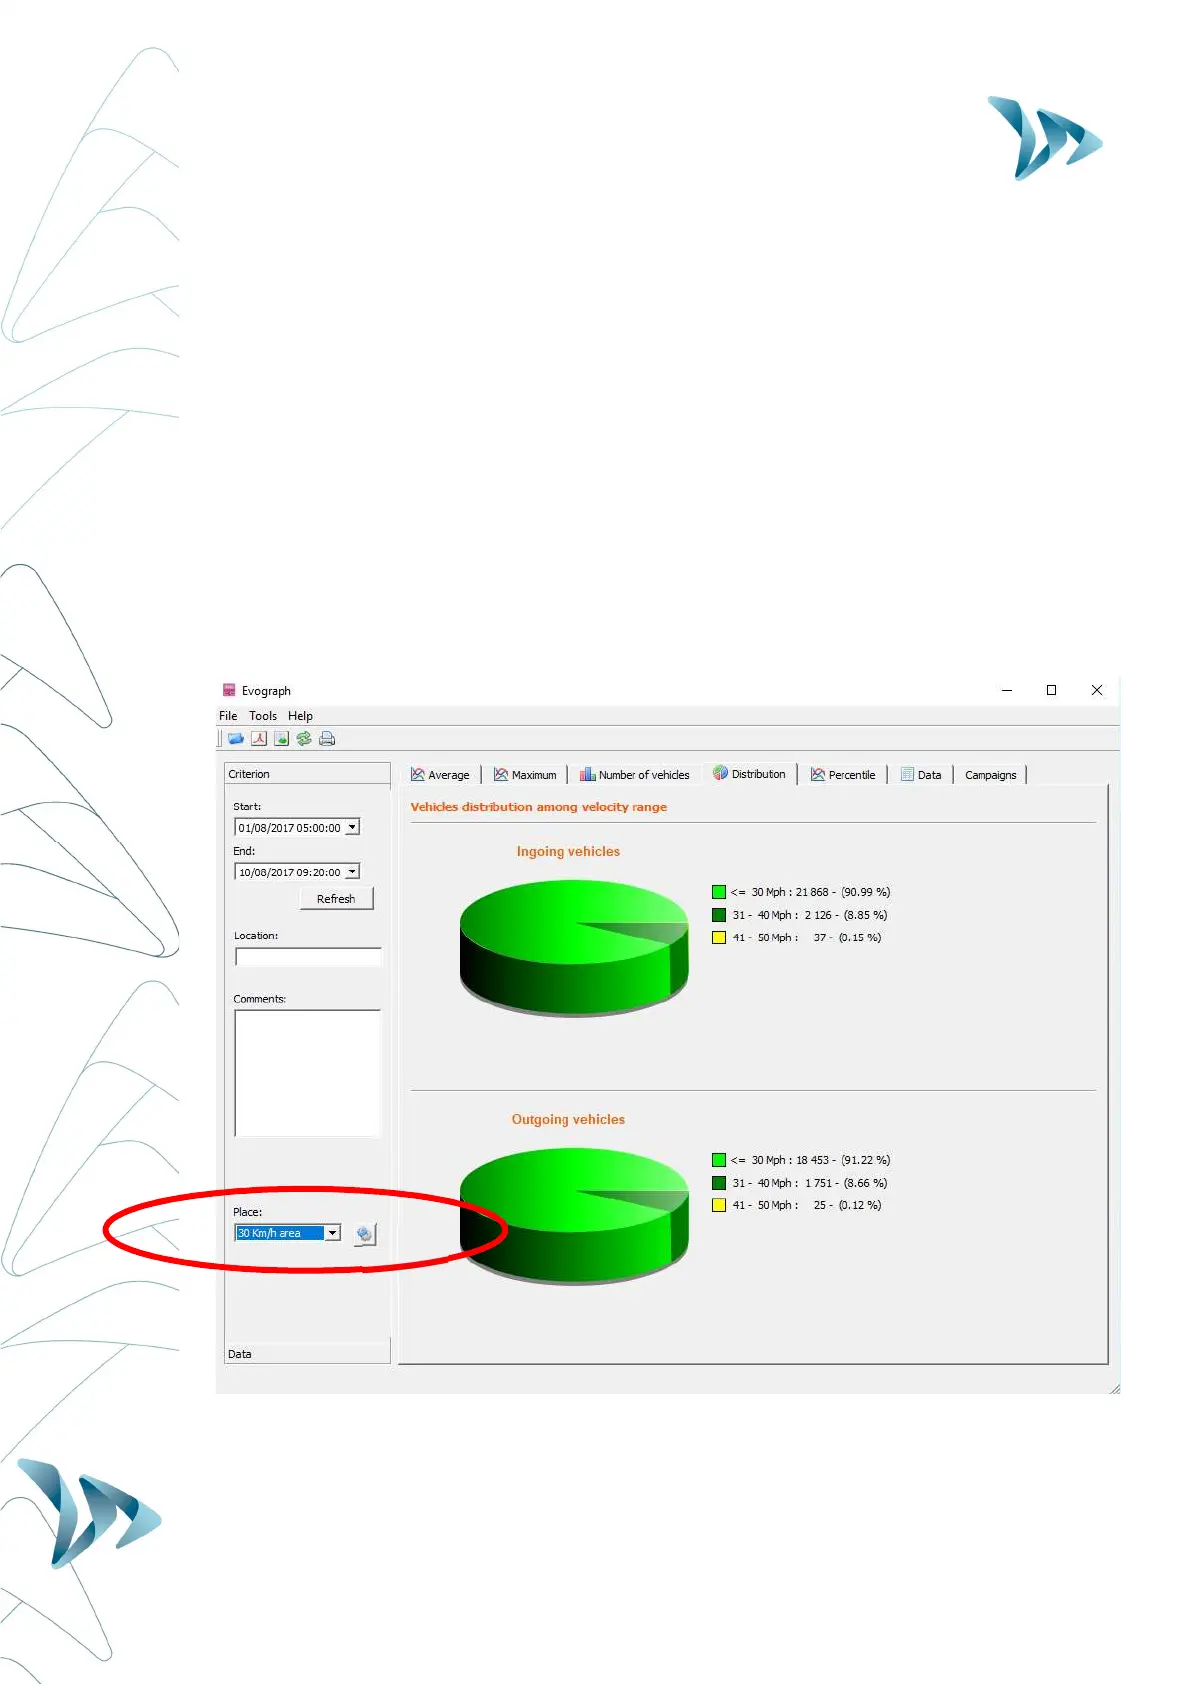
SPEED DISTRIBUTION
In this section, the recorded speeds are represented in pie chart form, and allows you to see
the percentage of vehicles which have, or have not, observed the speed limit.
Use the ‘Place’ drop down (3) to select the speed limit that applies to the location from where
the data has been captured
The example below is for a 20mph zone :
(3)