Table 2-3: Meter Monitor maintenance (continued)
Daniel MeterLink utility Diagnostics Action(s)
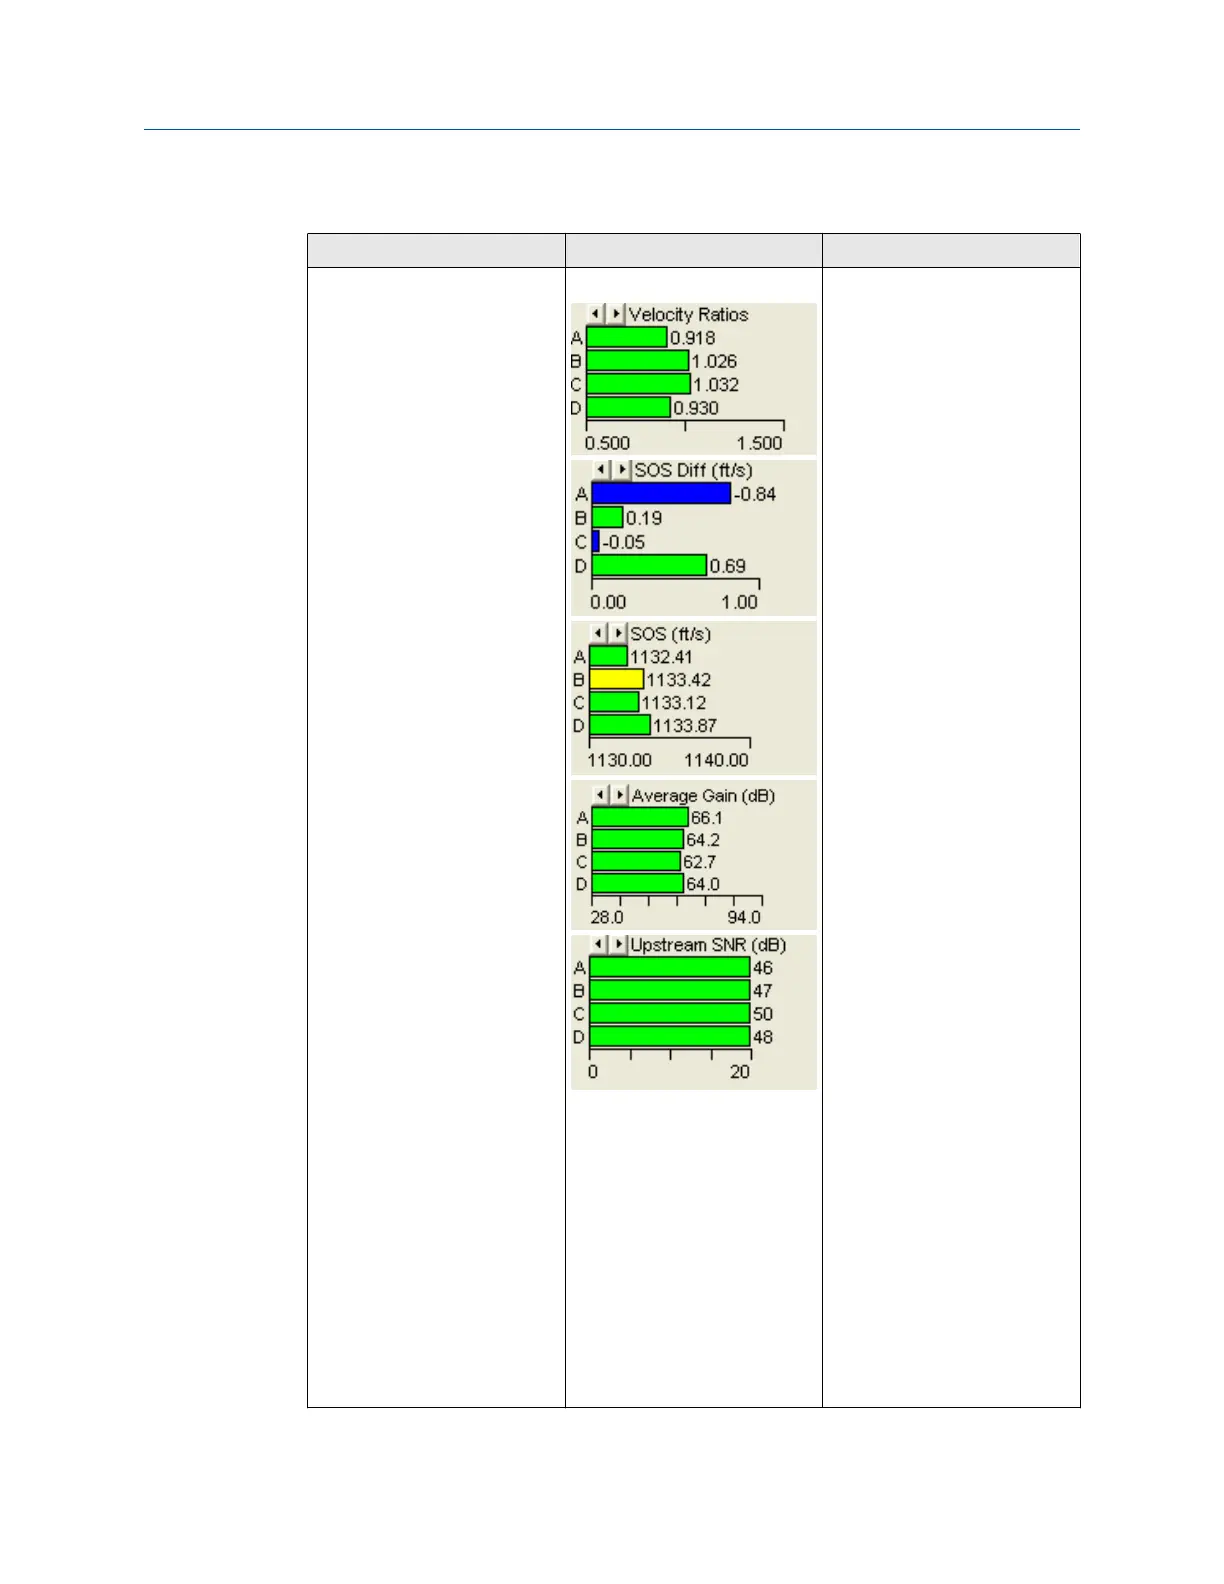
Meter Monitor (Detailed) view Flow Profile • A chord that causes the
spread for the Speed of
Sound to vary
morethan0.35%of the
Average Speed of Sound,
the bar for that chord turns
yellow.
• Clicking one of the arrows
at the top left of the graph
will change the chart to SOS
Differences from the
average meter speed of
sound. This provides a quick
indication on how much
spread in speed of sound is
between the chords.
Negative values are shown
in blue.
• Compare Gains and Signal
to Noise (SNR) ratios
decibel values with the
values in the Maintenance
log Inspection report from
the meter flow calibration.
• Check chord average signal
amplitudes with the meter
base line values in the
Maintenance log Inspection
report.
• The meter may not be in
measurement mode or
there are too few operating
chords.
• If a chord is hard failed, the
Check Status LED will
change from green to red.
The issue may be the
transducer pair for the
failed chord or the
transducer cabling. Resolve
the issue and clear the
alarm.
• If installed, check the flow
conditioner for blockage.
• If you have enabled the
Continuous Flow Analysis
feature, from the Meter
Monitor(Detailed)view,
Maintenance and Troubleshooting manual Troubleshooting
P/N 3-9000-791 August 2021
Maintenance and Troubleshooting manual 29

 Loading...