46 Chapter 5 Parameter Introductions
EV2000 Series Universal Variable Speed Drive User Manual
F0.21 Cut-off point used for
manual torque boost
Range:0~50%【10.0%】
F0.21 defines the ratio of the cut-off frequency used for
manual torque boost to the basic operating
frequency(defined by F0.06), as shown in Fig. 5-3 as fz.
This cut-off frequency adapts to any V/F curve defined
by F0.14.
5.2 Parameters of Reference Frequency
(Group F1)
F1.00 Reference frequency
curve selection
Range:000~111【000】
F1.01 Gain of reference
frequency selector
Range:0.00~9.99
【1.00】
F1.02 Reference constant of
filter
Range:0.01~50.00s
【0.50s】
F1.03 Max input pulse frequency
Range:0.1~50.0kHz
【10.0kHz】
F1.04 Min reference of curve 1
Range:0.0%~100.0%
【0.0%】
F1.05 Frequency corresponding
to the Min reference of curve 1
Range:0.0~650.0Hz
【0.00Hz】
F1.06 Max reference of curve 1
Range:0.0%~100.0%
【100.0%】
F1.07 Frequency corresponding
to the Max reference of curve 1
Range:0.0~650.0Hz
【50.00Hz】
F1.08 Min reference of curve 2
Range:0.0%~100.0%
【0.0%】
F1.09 Frequency corresponding
to the Min reference of curve 2
Range:0.0~650.0Hz
【0.00Hz】
F1.10 Max reference of curve 2
Range:0.0%~100.0%
【100.0%】
F1.11 Frequency corresponding
to the Max reference of curve 2
Range:0.0~650.0Hz
【50.00Hz】
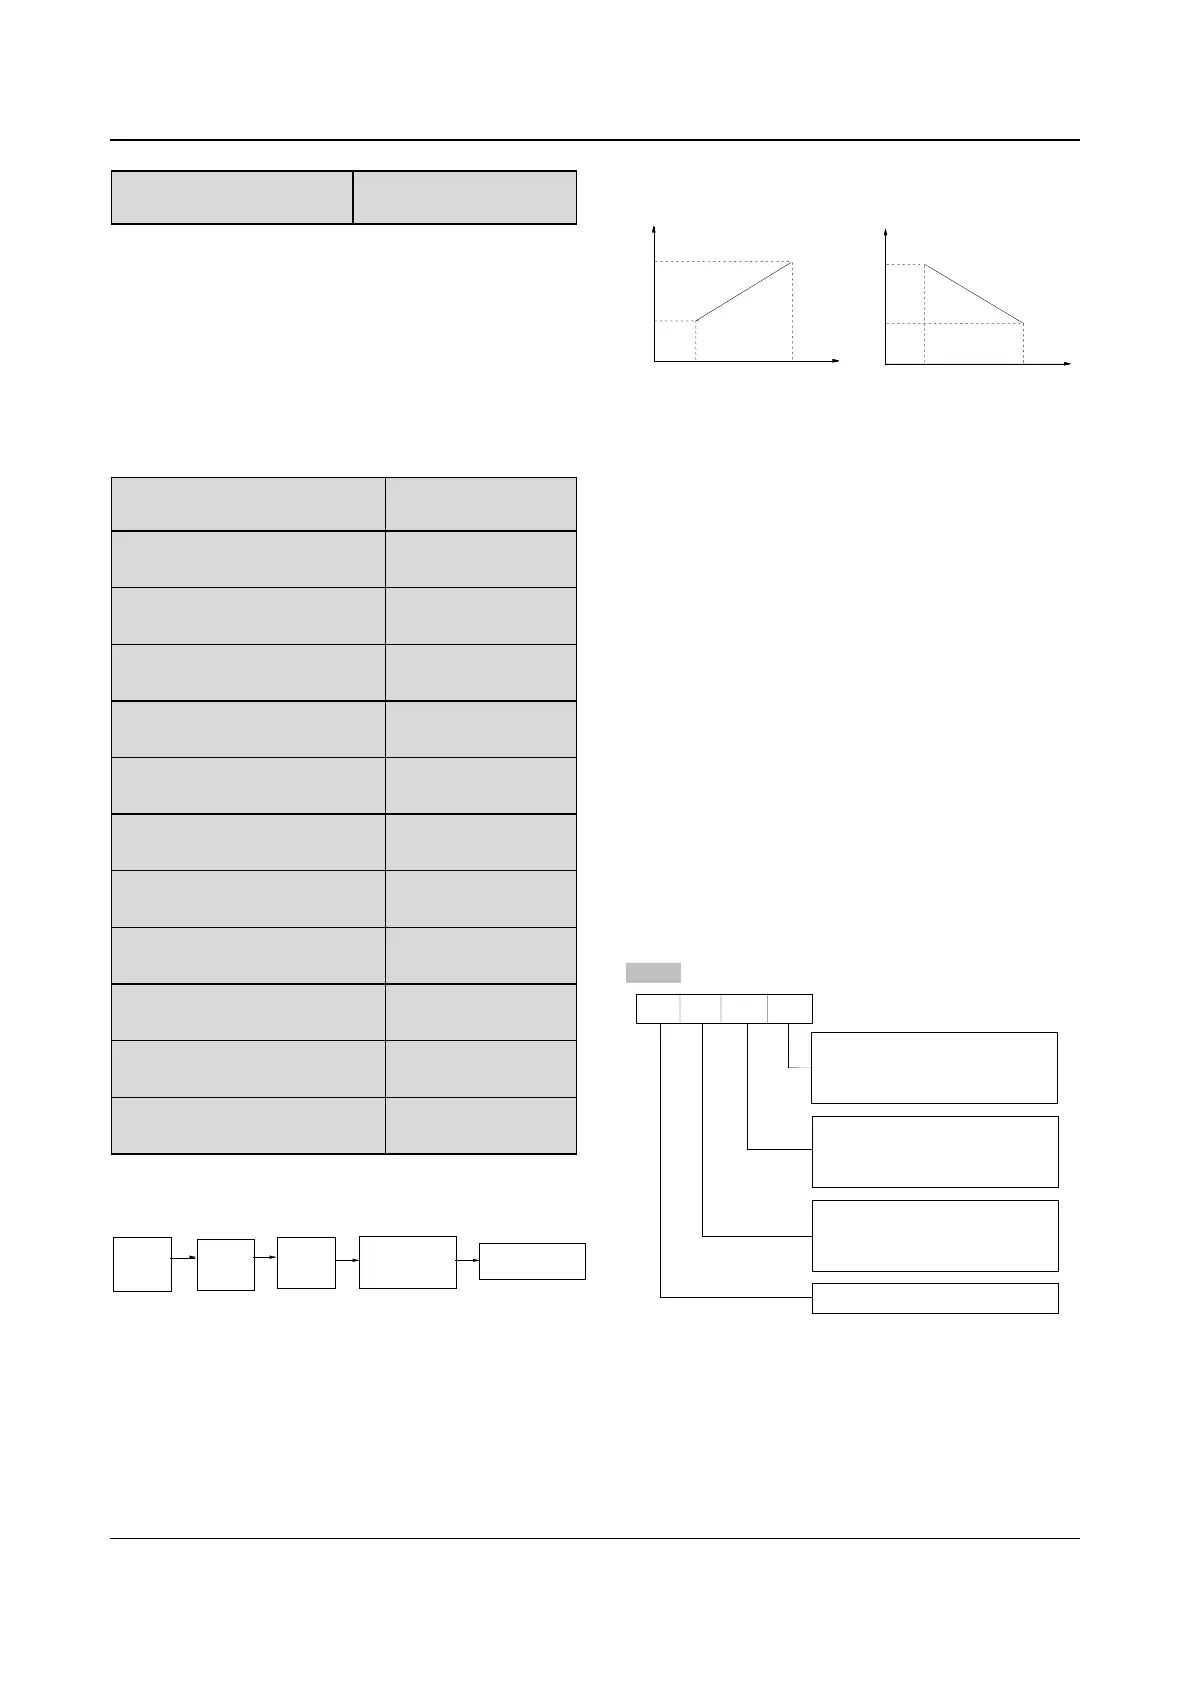
When VCI or CCI or pulse input(PULSE) is selected, the
relationship between reference and the preset frequency
is given below:
Preset frequency
Ref.
selection
F0.00
Amplify
F1.01
Filter
F1.02
Set Freq. curve
or select F1.00
A
P
Fig. 5-7 Relationship between reference and the preset
frequency
Reference frequency signal is filtered and amplified, and
then its relationship with the preset frequency is
determined by Curve 1 or 2. Curve 1 is defined by
F1.04~F1.07, and curve 2 is defined by F1.08~F1.11.
Positive and negative characteristics are shown in Fig.
5-8.
(2)
Negative
P
A
P
:
A
:Reference of analog signal
of VCI or CCI
: Freq.corresponding
to Min reference
Reference freq.
f
max
f
min
(1)
Positive
pulse terminal input
P
max
A
max
: Min. reference
P
min
Amin
P
A
A
P
max
max
min
min
P
A
f
max
f
min
Reference freq.
P
: Freq.corresponding
to Max reference
: Max. reference
f
max
max
A
max
f
min
Fig. 5-8 Output frequency curve
Analog input value(A) is a percentage without unit, and
100% corresponds to 10V or 20mA. Pulse frequency(P)
is also a percentage without unit, and 100%
corresponds to the Max pulse frequency defined by
F1.03.
F1.02 defines the time constant of the filter used by the
reference selector. The input signal is filtered and the
bigger the time constant, the higher the immunity level,
but the response time is prolonged with the increase of
the time constant. That is, the smaller the time constant,
the shorter the response time, but the lower the
immunity level.
F1.00 is used to select the output frequency curve when
VCI, CCI or PULSE input is selected, as shown in
Fig.5-9.
A
B
C D
VCI frequency curve selection
0 : Curve 1
0 : Curve 2
Reserved
CCI frequency curve selection
PULSE frequency curve selection
0 : Curve 1
0 : Curve 2
0 : Curve 1
0 : Curve 2
Fig. 5-9 Frequency curve selection
Where,
A: thousand’s place B: Hundred’s place
C: Ten’s place D: Unit’s place
For example, the requirements are: