27
4.6 Monitor
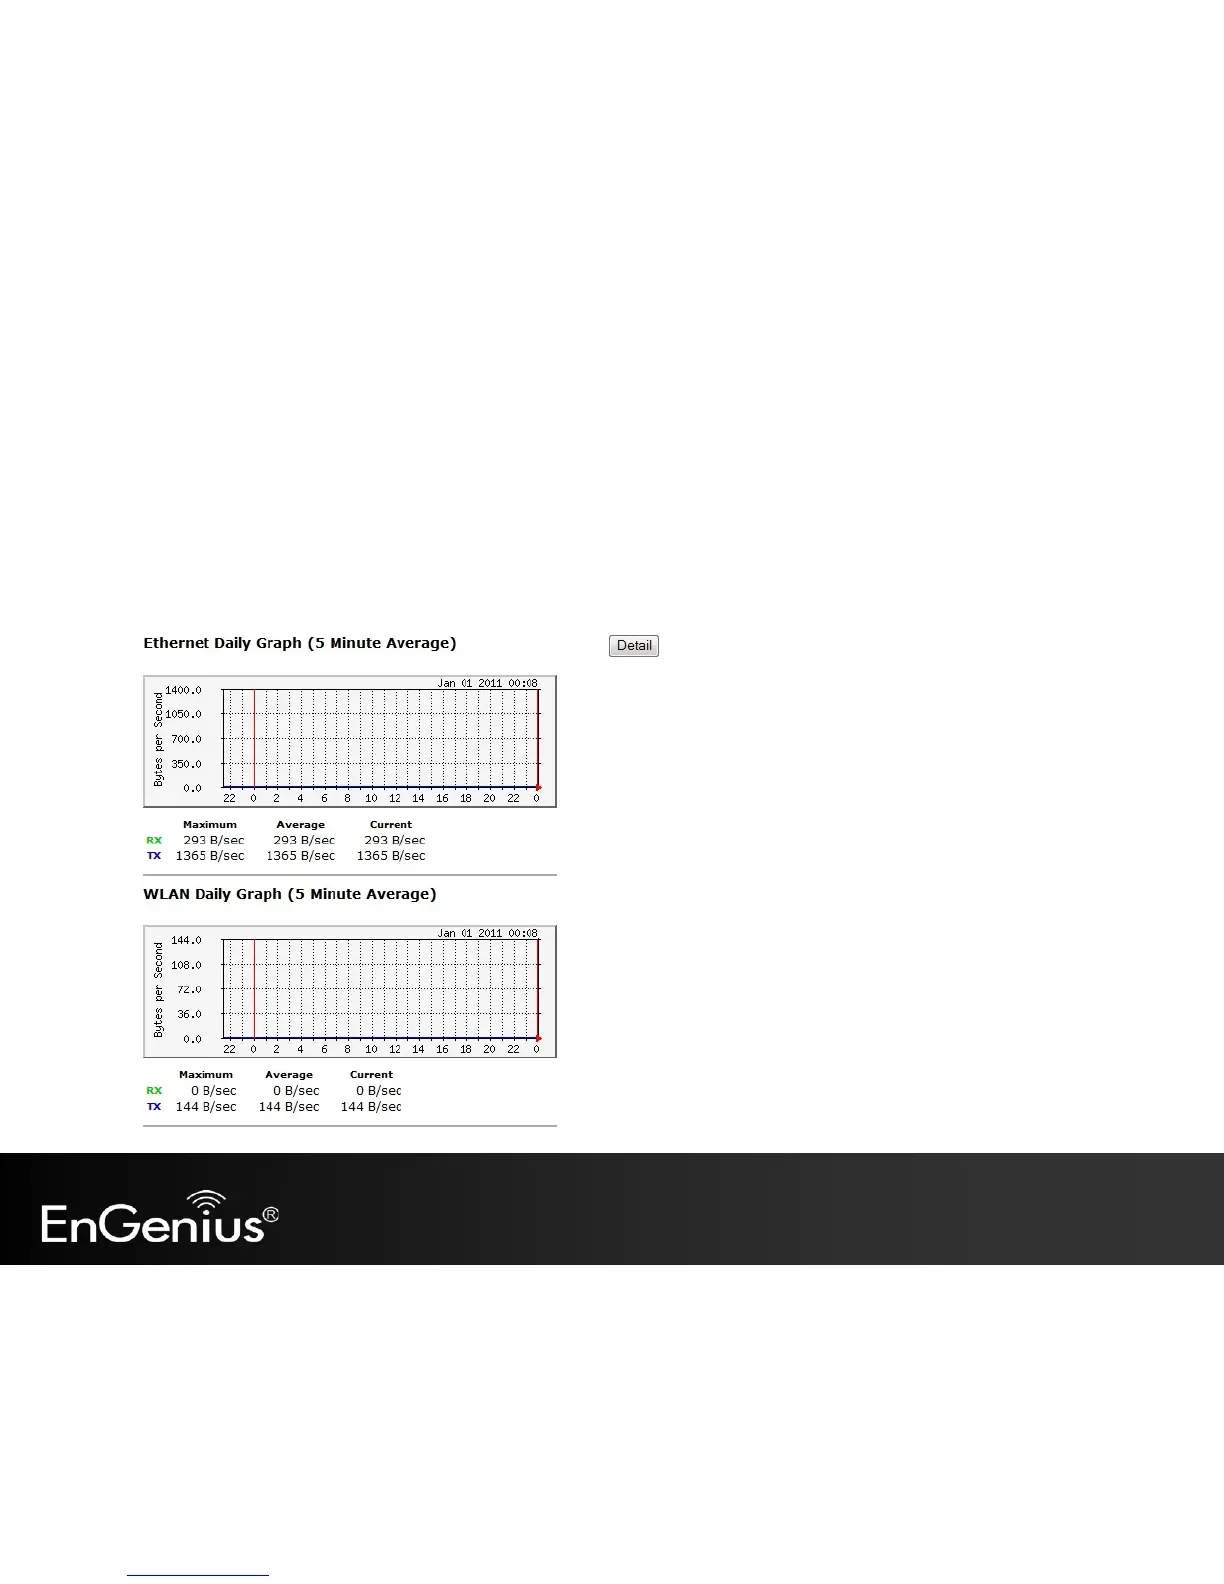
The Monitor option of the System menu displays 2 histogram graphs. The histograms represent the bandwidth usage
of both the daily use of the Ethernet and the daily use of the WLAN. If you click on Detail, a new browser window will
open with 4 additional histograms (6 total). In the new browser window, you will be able to view the weekly and
monthly bandwidth usage for both the Ethernet and WLAN.