SAIC Exploranium – GR-135 System Manual page: 64
3. Click the Search
icon. The Graph Pallette appears.
4. Select one of the options to let you block off a certain vertical, horizontal, or square portion of
the graph.
5. Drag the cursor across the area of the graph that you want to examine. That area now becomes
the focus. The Counts and Energy scales re-adjust accordingly.
6. Use the zoom options to magnify or reduce the area you are examining.
You can move the graph in any direction with the cursor by first clicking the
icon. Clicking the
icon returns the cursor to its normal state.
Examining the spectra in detail
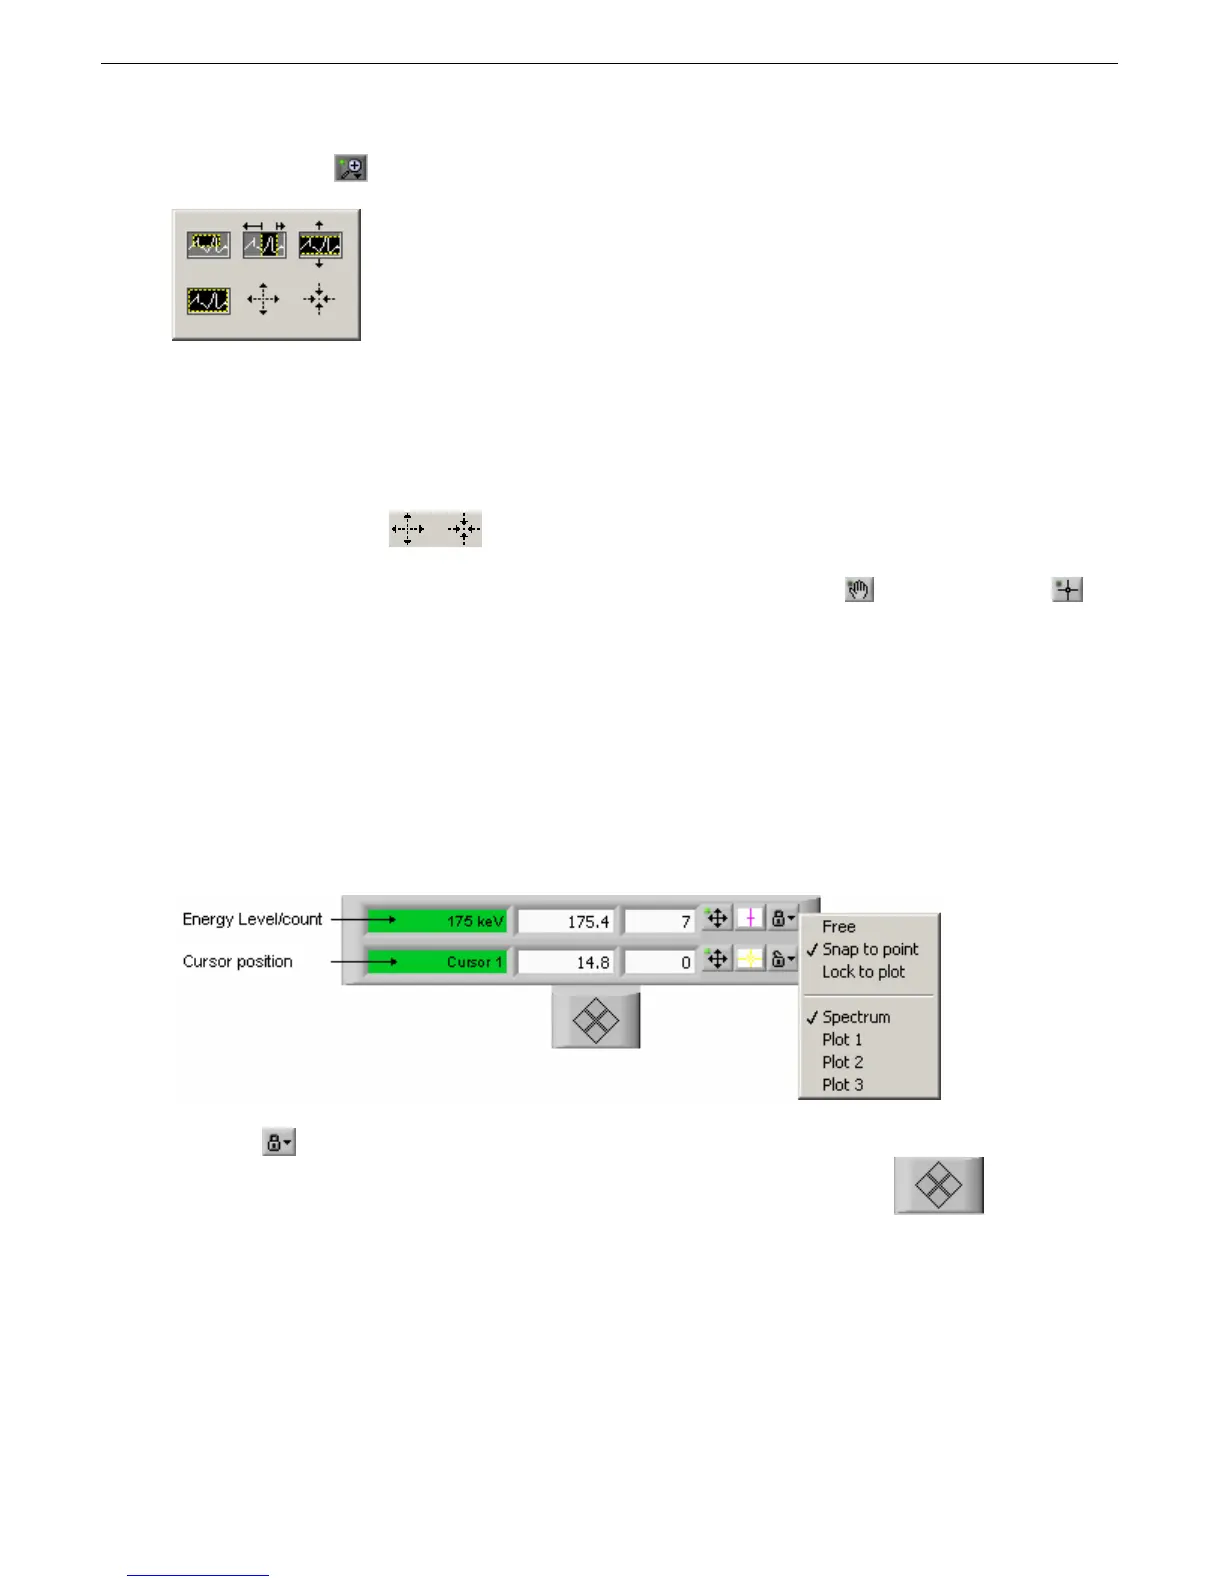
You can examine on certain portions of the spectra in more detail by using the Cursor Legend:
1. Turn off Auto-scaling by clicking the Scale menu and deselecting X Auto Scale and Y Auto Scale.
2. If you don’t see the Cursor Legend, right-click anywhere on the graph, select Visible Items, and
select Cursor Legend from the sub menu. The Cursor Legend appears.
3. Click the
icon, then select Snap to point.
4. Drag the cursor by the purple line or click the left and right arrows on the
pad.
The cursor will now follow the spectra activity lines, displaying the energy level at each point along the
scale. When the cursor moves close to any peak, the details are displayed in the Peak section.