48
Water pressure drop (kPa)
Water flow rate (l/s)
Operating range
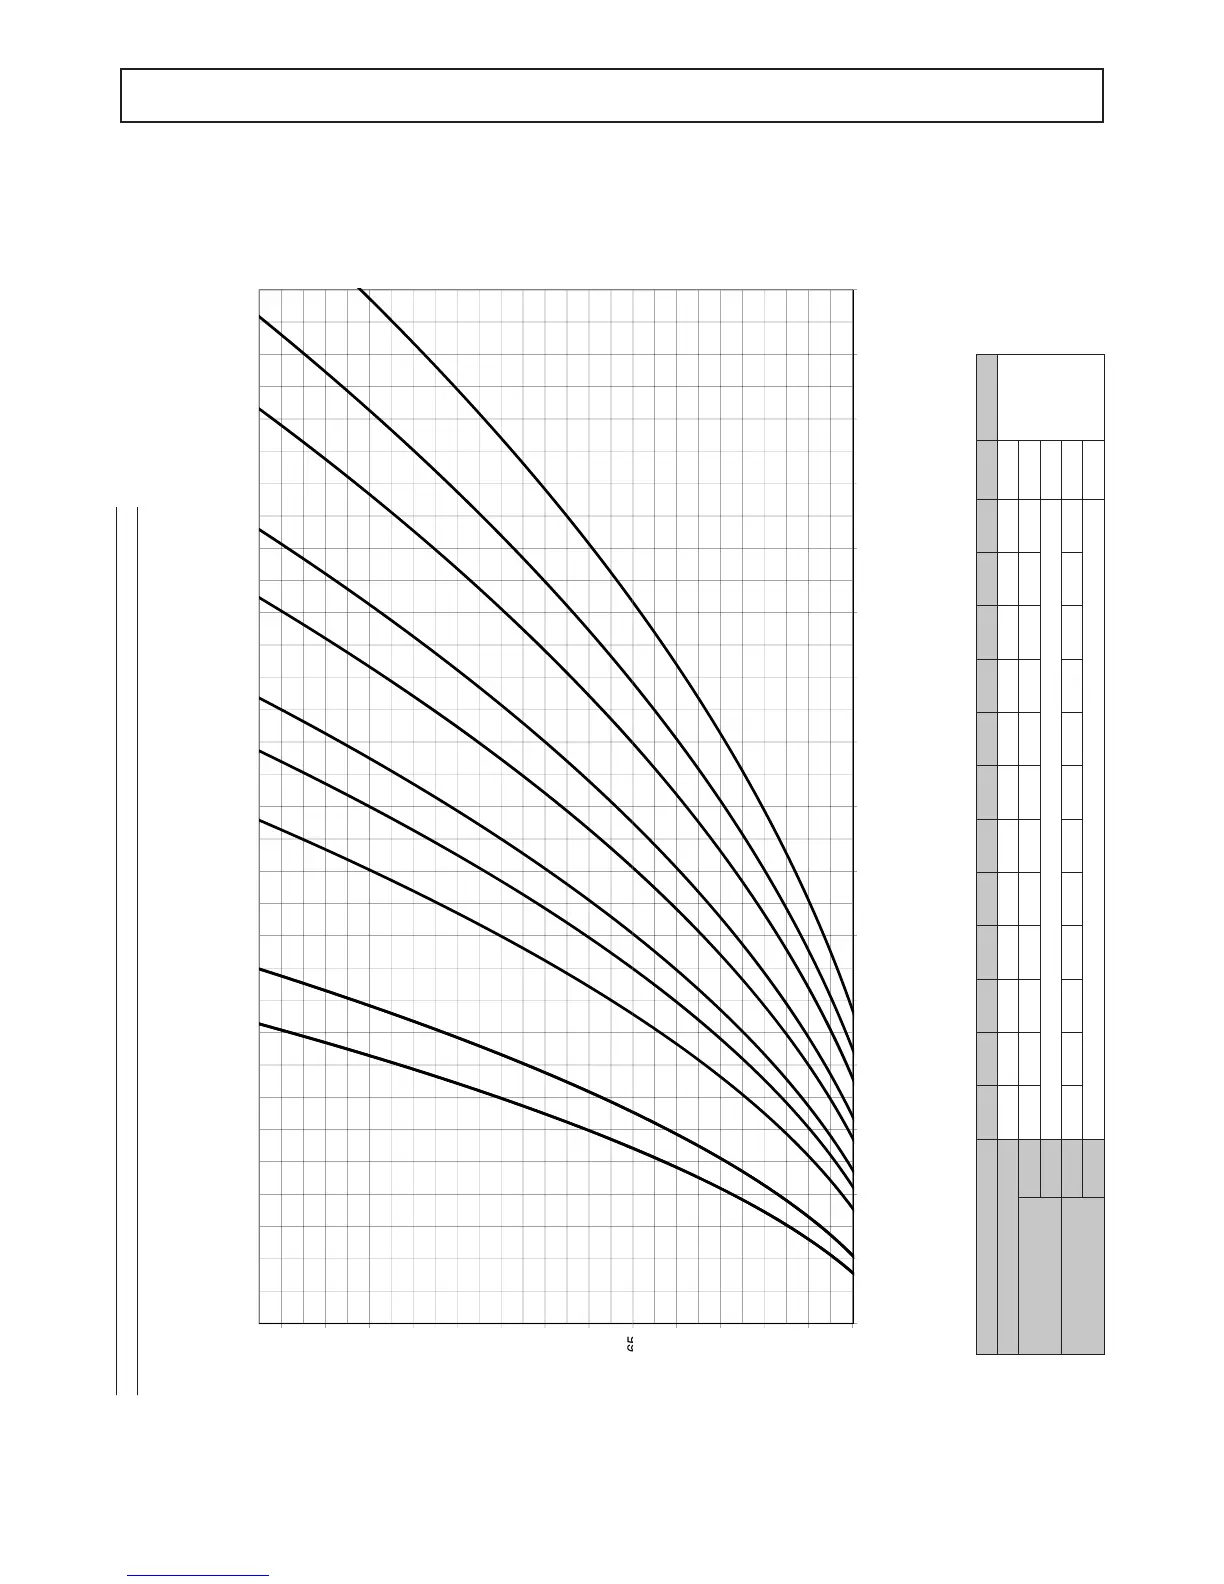
WATER PRESSURE DROP
Plant side exchanger
The graph below illustrates the water pressure drop values in kPa depending on the flow rate in liters/second. The operating range is delimited by the
minimum and maximum values given in the next table.
The graphs are referred to units operating with water at the temperature of 10°C (density 1000 kg/m
3
).
MODELS 40.2 50.2 60.2 70.2 80.2 90.2 100.2 115.2 130.2 145.2 160.2 180.2 UM NOTE
Graphic refer 1 1 2 2 3 4 5 6 7 8 9 10 -
Q= Water
ow rate
∆P= Water
pressure
drop
Lower limit value
Q 1,78 1,78 2,05 2,05 2,78 3,12 3,38 3,87 4,20 4,79 5,24 5,84 l\s
Δp 15 kPa
Upper limit value
Q 5,64 5,64 6,49 6,49 8,79 9,86 10,68 12,23 13,3 15,2 16,6 17,0 l\s
Δp 150 kPa
1,0 2,0 3,0 4,0 5,0 6,0 7,0 8,0 9,0 10,0 11,0 12,0 13,0 14,0 15,0 16,0 17,0
1 2 3 4 5 6 7 8 9
10
 Loading...