EasyManua.ls Logo

Fluke OptiView Series User Manual

Fluke OptiView Series
42 pages
To Next Page IconTo Next Page
Page #1 background imageLoading...
Page #1 background image
TM
OptiView
TM
Workgroup Analyzer
Getting Started Guide
PN 1606384
September 2001, Rev. 2, 9/02
© 2001, 2002 Fluke Networks, Inc. All rights reserved. Printed in USA
All product names are trademarks of their respective companies.

Table of Contents

Question and Answer IconNeed help?

Do you have a question about the Fluke OptiView Series and is the answer not in the manual?

Fluke OptiView Series Specifications

General IconGeneral
CategoryNetwork Analyzer
ModelOptiView Series
TypePortable Network Analyzer
Protocols SupportedTCP/IP
InterfacesEthernet, USB, Wireless
FeaturesNetwork Discovery, Traffic Analysis, Troubleshooting
DisplayColor LCD (size and resolution vary by model)
Power SourceRechargeable Battery, AC Adapter
Operating Temperature32°F to 104°F (0°C to 40°C)
Storage Temperature-20°C to 60°C (-4°F to 140°F)

Summary

LIMITED WARRANTY & LIMITATION OF LIABILITY

Before You Start

Safety Information

Contains warnings and cautions for safe operation and potential hazards.

Cleaning the Analyzer

Fluke Networks Support and Registration

The Analyzer and Accessories

Analyzer Models

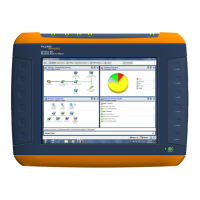
Describes the Workgroup, Pro, and Pro Gigabit models and their features.

Supplied Out of the Box Items

Other Available Accessories

Software Accessories

OptiView Reporter, Protocol Expert, Inspector Console software tools.

Hardware Accessories

Rackmount kit and Fiber Optic Test Kit.

Fiber Optic GBIC Modules

Service and Upgrade Packages

About the Analyzer

General Specifications

Details technical specifications like interfaces, LEDs, memory, and ports.

External Connections and LEDs

Explains the analyzer's physical ports and status indicator lights.

Connecting to the Network Under Test (NUT) Interface

Connecting to the Management Port

Accessing the Analyzer via User Interface Software

User Interface Features

Lists key capabilities of the analyzer's user interface software.

Using the OptiView Browser

How to use the OptiView Browser to discover and access analyzers.

Browser Actions

UI Software Operations

Overview of the User Interface Front Page Screen

Front Page Screen Details

Using the Analyzer

Basic Operations

Powering on, verifying operation, capturing files, and generating reports.

Network Traffic Generation

Using the Traffic Generator screen to create network load.

Cable Testing and GBIC Module Management

Configuring via Serial Port

Root Mode Commands

Lists commands for the analyzer's root configuration mode.

Management Configuration Commands

Network Configuration Commands and Guidelines

Setting Remote Control PC IP Address

Setting OptiView Inspector Console Address

Setting Analyzer IP Address on Network Under Test Interface

Setting Analyzer IP Address on Management Port

Setting Up Analyzer Security

Password Control and Feature Selection

Controls password protection for security and feature access.

SNMP Community Strings and Default Configuration

Installing Options

Using the Built-in Help System

Accessing and Navigating Help System

How to access and use the analyzer's integrated help system.

Help Language and Online Documentation

Updating the OptiView Workgroup Analyzer Firmware

Software Update Procedure

Outlines the two-step process for updating analyzer and PC software.

Troubleshooting Your Analyzer

Common Troubleshooting Scenarios

Addresses lockups, IP discovery issues, network connectivity, and cable test failures.

Safety and General Specifications

Supported Network Standards

Cable Specifications

Details supported cable types and measurable lengths for testing.

Electrical and Signal Specifications

Related product manuals