Do you have a question about the Fluke OptiView II Series and is the answer not in the manual?
General safety symbols and warnings for operating the analyzer.
Instructions for cleaning the analyzer's touch display and case using safe methods.
Procedure for reporting and handling instrument damage incurred during shipping.
Provides contact details for Fluke Networks sales, service, and support centers globally.
Details product support entitlement, knowledge base access, and registration benefits.
Explains how to obtain and apply software improvements and updates for the analyzer.
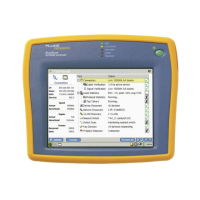
Describes the different hardware configurations of the OptiView Series II analyzer.
Illustrates and lists the standard accessories included with the OptiView Series II analyzer.
Detailed list of items supplied with the OptiView Series II Integrated Network Analyzer.
Lists and describes optional accessories for the OptiView Series II analyzer.
Continues the list and descriptions of optional accessories for the OptiView Series II analyzer.
Details the external accessory connectors available on the analyzer unit.
Explains the process of registering the OptiView analyzer for support and updates.
Instructions for turning the analyzer on, off, and placing it into standby mode.
Describes the boot sequence and initial display verification for the analyzer.
Explains how the analyzer operates on internal and external batteries, and their expected runtime.
Step-by-step guide on how to physically connect the external battery pack to the analyzer.
Details the process and status indicators for charging the analyzer's internal and external batteries.
Explains how to check the charge status of the external battery using its indicator LEDs.
Covers configuring power management settings to optimize battery life and reduce power consumption.
Instructions on using the touch panel display, adjusting target size, and calibrating the screen.
Explains the use of the on-screen virtual keyboard and IP keypad for data entry.
Describes how to perform a right-click equivalent using the touch panel display for convenience.
Details how to connect external USB keyboards and mice to the analyzer.
Instructions for extending the analyzer's stand and locating the stylus.
Explains how to connect an external monitor using the VGA out port.
Illustrates the top view of analyzers and their network ports.
Guide on connecting the analyzer to a network to begin testing and auto-discovery.
Explains the meaning of the various LED indicators on the analyzer's front panel.
Detailed explanation of the conditions indicated by the Link, Transmit, Collision, Errors, and Utilization LEDs.
Overview of the Front Page screen elements and their function in network monitoring.
Explains how to view and interpret the status of device and network discovery processes.
Describes the function of various buttons at the bottom-right of the analyzer screen.
Details the Cable Test button and how it summarizes cable status and identifies issues.
Explains the Switch Statistics and Utilization Statistics features for network analysis.
Describes the Protocol Statistics and Device Discovery features for network analysis.
Explains the Network Discovery and Problem Discovery features for network analysis and troubleshooting.
How to use the Traffic Generator to create network load for stress testing.
Instructions for testing network cables, including length measurement and cable type selection.
Guide to adding printers, including the default PDF printer setup.
Procedure for removing and installing GBIC modules on Pro Gigabit analyzers.
Explains the preconfigured Windows network settings for analyzer communication.
Details the critical TCP/IP settings for the data acquisition board and their importance.
How to use the OptiView Browser to access and manage analyzers remotely.
Describes actions like refreshing lists, launching interfaces, and updating firmware via the OptiView Browser.
Instructions for installing the remote user interface software from the resource CD.
Lists conditions that can cause a remote user interface session to terminate.
Covers security settings for packet capture, remote access, and SNMP configuration.
How to change the analyzer's name for identification, especially in discovery and SNMP.
How to set passwords for packet capture and remote access, and enable/disable features.
Explains how to set up AES 128-bit data encryption for remote interface communication.
Configuring the IP address of the PC for remote OptiView Browser sessions.
Configuring the IP address for the OptiView Console agent for interoperability.
Configuring SNMP community strings for accessing MIB II and RMON agent information.
How to activate purchased options like WAN Vision using key codes.
How to access the built-in help system via the Help button and navigate its content.
Instructions for changing the default display language of the help system.
Information on accessing PDF documentation and online help from the resource CD.
Procedures for resetting the analyzer or forcing a complete power-off.
Basic steps to perform before contacting technical support for common analyzer issues.
Addresses common issues like touch screen calibration, network connectivity, cable tests, and battery problems.
Precautions for configuring Windows settings for file sharing and TCP/IP applications.
Procedure for restoring the analyzer to its original factory default configuration and software.
Detailed technical specifications of the OptiView Series II Integrated Network Analyzer.
Lists the network standards and SNMP MIBs supported by the analyzer's interfaces.
Details supported cable types and specifications for cable length measurements.
Covers characteristic impedance, receive level, datalink signal, and fault tolerance.
Information on GBIC module identification and WireView compatibility.
Specifies operating and non-operating temperature, altitude, and electromagnetic interference compliance.
| Brand | Fluke |
|---|---|
| Model | OptiView II Series |
| Category | Measuring Instruments |
| Language | English |