Do you have a question about the Fluke 190 Series II and is the answer not in the manual?
Identifies conditions and actions that pose hazards to the user.
Provides recommendations for safe storage and use of the Li-ion battery pack.
Step-by-step guide on how to power the test tool from an AC outlet.
Instructions on how to reset the test tool to its factory settings.
Demonstrates how to use the test tool's menus to select functions and items.
Explains how to close menus or hide key labels for a cleaner display.
Explains the function of the illumination LEDs on certain keys.
Describes the safety BNC jack signal inputs and banana jack inputs.
Guides on connecting voltage probes to the appropriate inputs for measurements.
Details how to set probe types and attenuation factors for accurate measurements.
Instructions on how to select and enable input channels for measurements.
Explains how to automatically display complex, unknown signals using Connect-and-View.
Describes how to perform automatic scope measurements and display numeric readings.
How to freeze the screen display, including readings and waveforms, at any time.
Discusses using average, persistence, and glitch capture functions for waveform analysis.
Explains how to use persistence, envelope, and dot-join for displaying dynamic signals.
Instructions on how to capture and display glitches on a waveform.
Methods to reduce high frequency noise using glitch detection and averaging.
Setting the acquisition speed and waveform memory depth for capturing signals.
Details on setting acquisition speed (Fast, Full, Normal) and memory depth.
How to select AC-coupling to observe small AC signals on a DC signal.
Instructions on how to invert a displayed waveform for better visualization.
How to continuously adjust input sensitivity for precise amplitude settings.
Techniques to suppress high frequency noise by limiting bandwidth.
How to perform mathematical operations on waveforms and create XY plots.
Explains how to use the Spectrum function for analyzing spectral content via FFT.
How to display a reference waveform alongside the actual waveform for comparison.
Using a reference waveform as a template to test actual waveforms for pass/fail criteria.
Using analysis functions like CURSOR, ZOOM, and REPLAY for detailed waveform analysis.
Steps to access the recorder main menu from scope or meter mode.
How to use the TrendPlot function to graph measurements over time.
Step-by-step guide to initiate a TrendPlot recording.
How to view recorded data in normal or overview mode.
Options for changing the time reference (Time of Day or From Start).
Instructions to exit the recorder function.
Using the SCOPE RECORD function to log long waveforms in deep memory.
How to start recording scope waveforms in deep memory.
How to view recorded samples in deep memory or in view all mode.
Using Single Sweep to automatically stop recording when deep memory is full.
Utilizing trigger signals to start or stop scope recording for capturing events.
How to analyze recorded data using CURSORS and ZOOM functions.
How the test tool automatically stores and allows replay of the last 100 screens.
Procedures for stepping through previous and next recorded screens.
How to replay stored screens continuously, similar to a video tape.
Instructions to turn off the REPLAY function.
Using trigger capabilities to capture 100 intermittent signals for later replay.
How to obtain a more detailed view of a waveform using the ZOOM function.
Instructions to turn off the ZOOM function.
Using cursors to make precise digital measurements on waveforms.
How to use horizontal cursors for voltage and amplitude measurements.
How to use vertical cursors for time measurements and RMS values.
Measuring cursor values on mathematical result waveforms like Watts.
Performing cursor measurements on spectrum analysis results.
How to measure the rise time of a waveform using cursors.
Manually optimizing trigger level and slope for stable waveform display.
Displaying waveforms before or after the trigger point for better analysis.
Changing settings for automatic triggering behavior and frequency response.
Using edge triggering for full manual control over unstable or low-frequency signals.
Using trigger filters to reduce jitter when triggering on noisy waveforms.
Performing a single-shot acquisition to capture single events or glitches.
Enabling stable pictures of n-cycle burst waveforms by triggering after N cycles.
Using external signals as a trigger source for displaying waveforms.
Triggering on video signals by selecting standards and polarity.
Triggering on either the first or second half of a video frame.
Triggering on all synchronization pulses or selecting specific video lines.
Isolating and displaying specific pulses qualified by time.
Setting the tool to trigger on narrow positive pulses shorter than a specified duration.
Triggering on gaps larger than a certain duration to find missing pulses in a train.
Describes the two USB ports for connecting external memory and PCs.
How to save and recall screens, setups, and recordings to internal or USB memory.
Steps to save a screen and its associated setup configuration.
Handling messages when no free memory locations are available for saving.
How to name saved screens and setups according to user preferences.
Saving a screen in bitmap format for printing or external use.
Procedures for deleting saved screens and their associated setups.
How to recall saved screens and setups for analysis or comparison.
Loading a saved setup configuration to resume measurements.
Scrolling through memories to view stored screens.
Modifying the names of stored screens and setup files.
Copying or moving files between internal memory and a USB device.
Utilizing FlukeView software to upload waveform data and screen bitmaps to a PC.
Steps for connecting the test tool to a PC to use FlukeView software.
Illustrations showing the use of standard accessories like probes and test leads.
Proper connection of HF voltage probes using a ground spring.
Connecting HF voltage probes using a probe tip to BNC adapter.
Utilizing floating isolated inputs for measuring signals independently.
How each input section has its own signal and reference input, isolated from others.
How to use the tilt stand for optimal viewing angle on a table.
Using the security slot compatible with a Kensington lock for physical security.
Instructions on how to attach the supplied hang strap correctly.
Resetting the test tool to factory settings without clearing memories.
How to close menus or hide key labels for a cleaner screen.
Selecting the language for messages displayed on the screen.
How to adjust the screen's contrast and backlight brightness.
Procedures for changing the instrument's date and time settings.
Techniques to conserve battery power, including auto power down and display auto-off.
Adjusting the automatic power shutdown time for battery saving.
Configuring the display to turn off automatically after a set time to save battery.
Choosing how auto set behaves when the AUTO-MANUAL key is pressed.
Safe procedures for cleaning the test tool using a damp cloth and mild soap.
Recommendations for storing the test tool for extended periods, including battery charging.
How to charge the Li-ion batteries using the power adapter or an external charger.
Step-by-step instructions for safely replacing the battery pack.
Adjusting voltage probes for optimal response through high frequency and DC calibration.
General overview of performance and environmental characteristics.
Guarantees of properties expressed in numerical values with stated tolerances.
Data related to environmental conditions based on manufacturer verification.
Compliance with electrical safety standards and important user warnings.
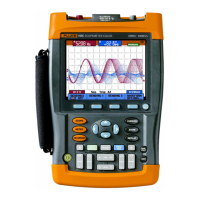
Detailed technical specifications for the oscilloscope functions, including inputs, bandwidth, and sampling rates.
Specifications for trigger modes, delay, video, pulse width, and auto set functions.
Detailed specifications for automatic scope, DC, AC, AC+DC voltage, current, peak, frequency, duty cycle, pulse width, Vpwm, V/Hz, power, phase, temperature, and decibel measurements.
Specifications for meter measurements including Ohms, Continuity, and Diode tests for different models.
Specifications for 10:1 probes and electromagnetic immunity.
Miscellaneous specifications including display, power, probe calibration, memory, ports, mechanical, and environmental data.
Safety information, max input voltages, floating voltage, and certifications.
Step-by-step guide for installing USB drivers for computer communication.
Information regarding the Material Safety Data Sheet for the Li-ion battery pack.
Procedures related to instrument memory and security measures.
| Display | Color LCD |
|---|---|
| Bandwidth | Up to 200 MHz |
| Vertical Resolution | 8 bits |
| Maximum Input Voltage | 400 V (DC + peak AC) |
| Vertical Sensitivity | 2 mV/div to 10 V/div |
| Input Channels | 2 or 4 |
| Battery Life | 4 hours |
| Connectivity | USB |
| Input Coupling | AC, DC, GND |
| Input Impedance | 1 MΩ |
| Operating Temperature | 0 °C to +50 °C |
| Storage Temperature | -20 °C to +60 °C |
| Power | Li-Ion battery (BP291) or AC adapter |