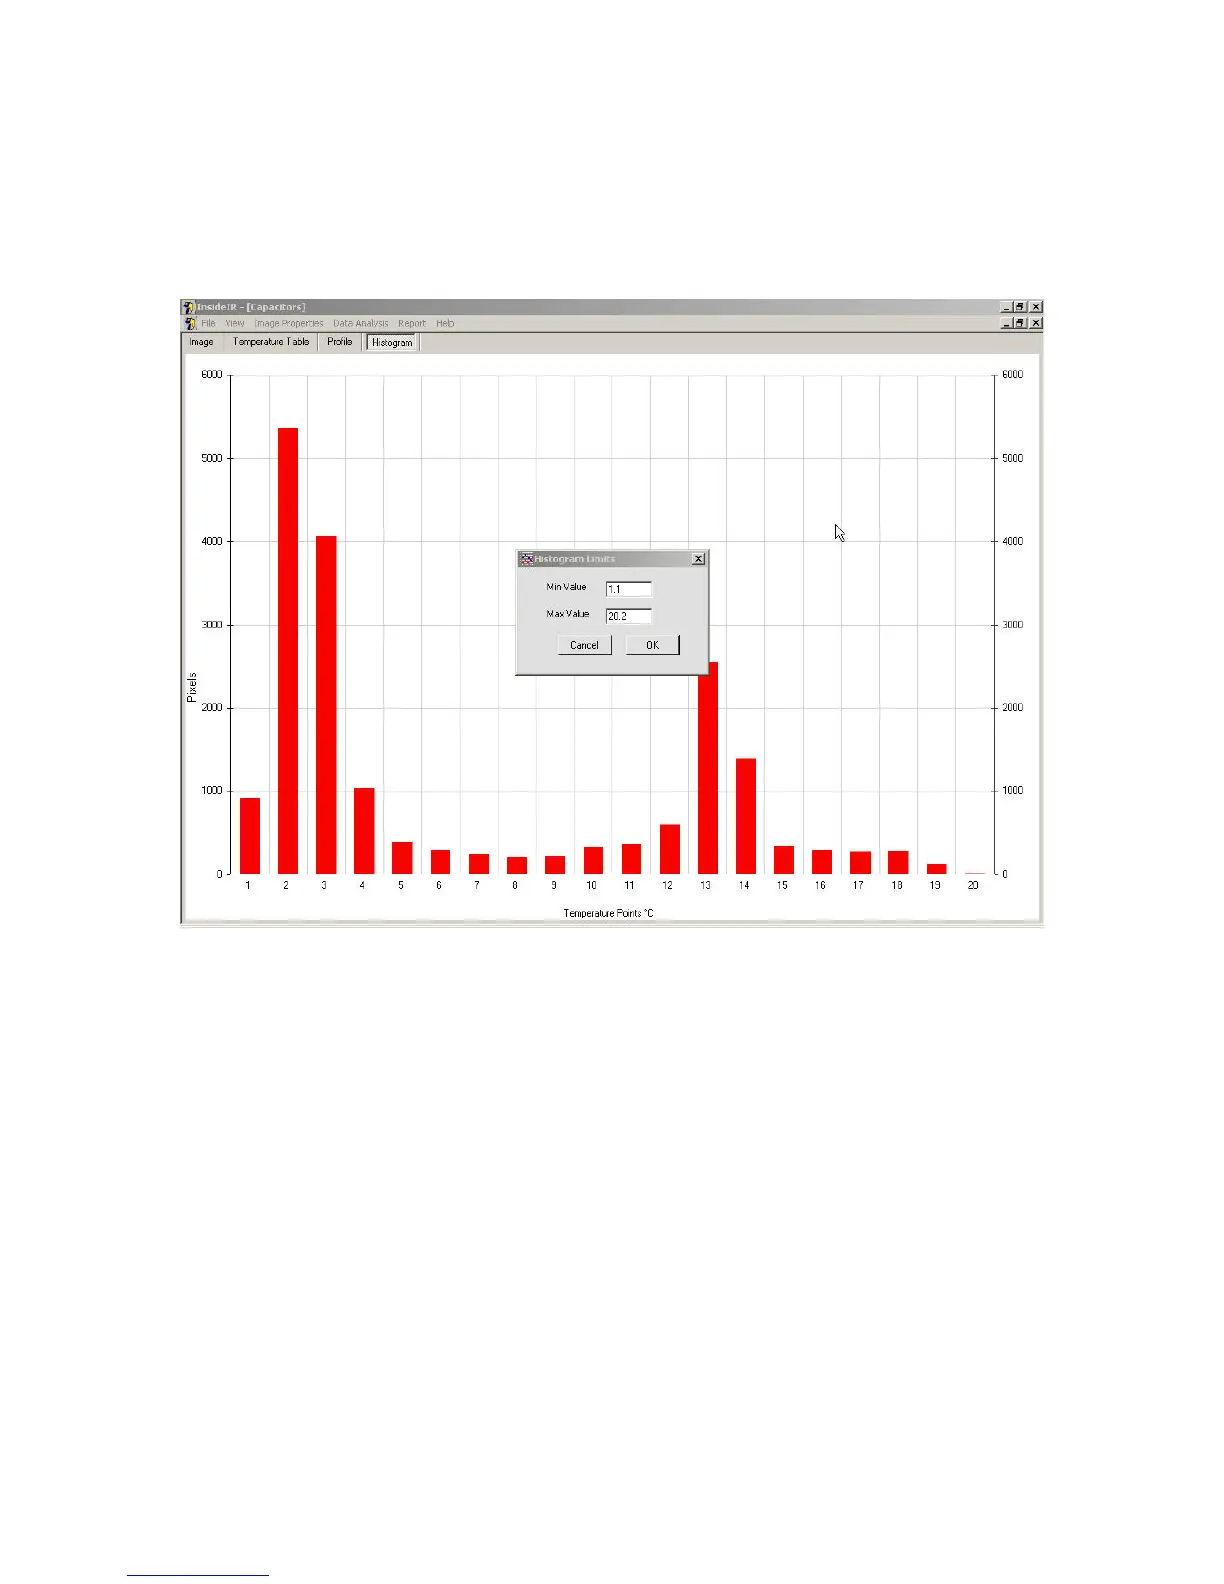
To view a subset of the data, you may select Limits on the Data Analysis > Histogram >
Limits menu, and enter the specific maximum and minimum temperatures for the data you
are interested in graphing.
Figure 67. The Histogram Tab – Changing the Histogram Limits
If you wish to use the chart or chart data in another program, you may select Copy on the
Data Analysis > Histogram > Copy menu. The information will be saved to your Windows
clipboard, and can then be pasted into Microsoft Word or Excel or other compatible
program, using either the Paste or Paste Special command.
The Menu Bar
Now that you’re familiar with the concepts in the four tabs, you’ll quickly understand the
choices offered on the menu bar. Each menu item is briefly described below.
Jan 31st, 2005 - 79 -