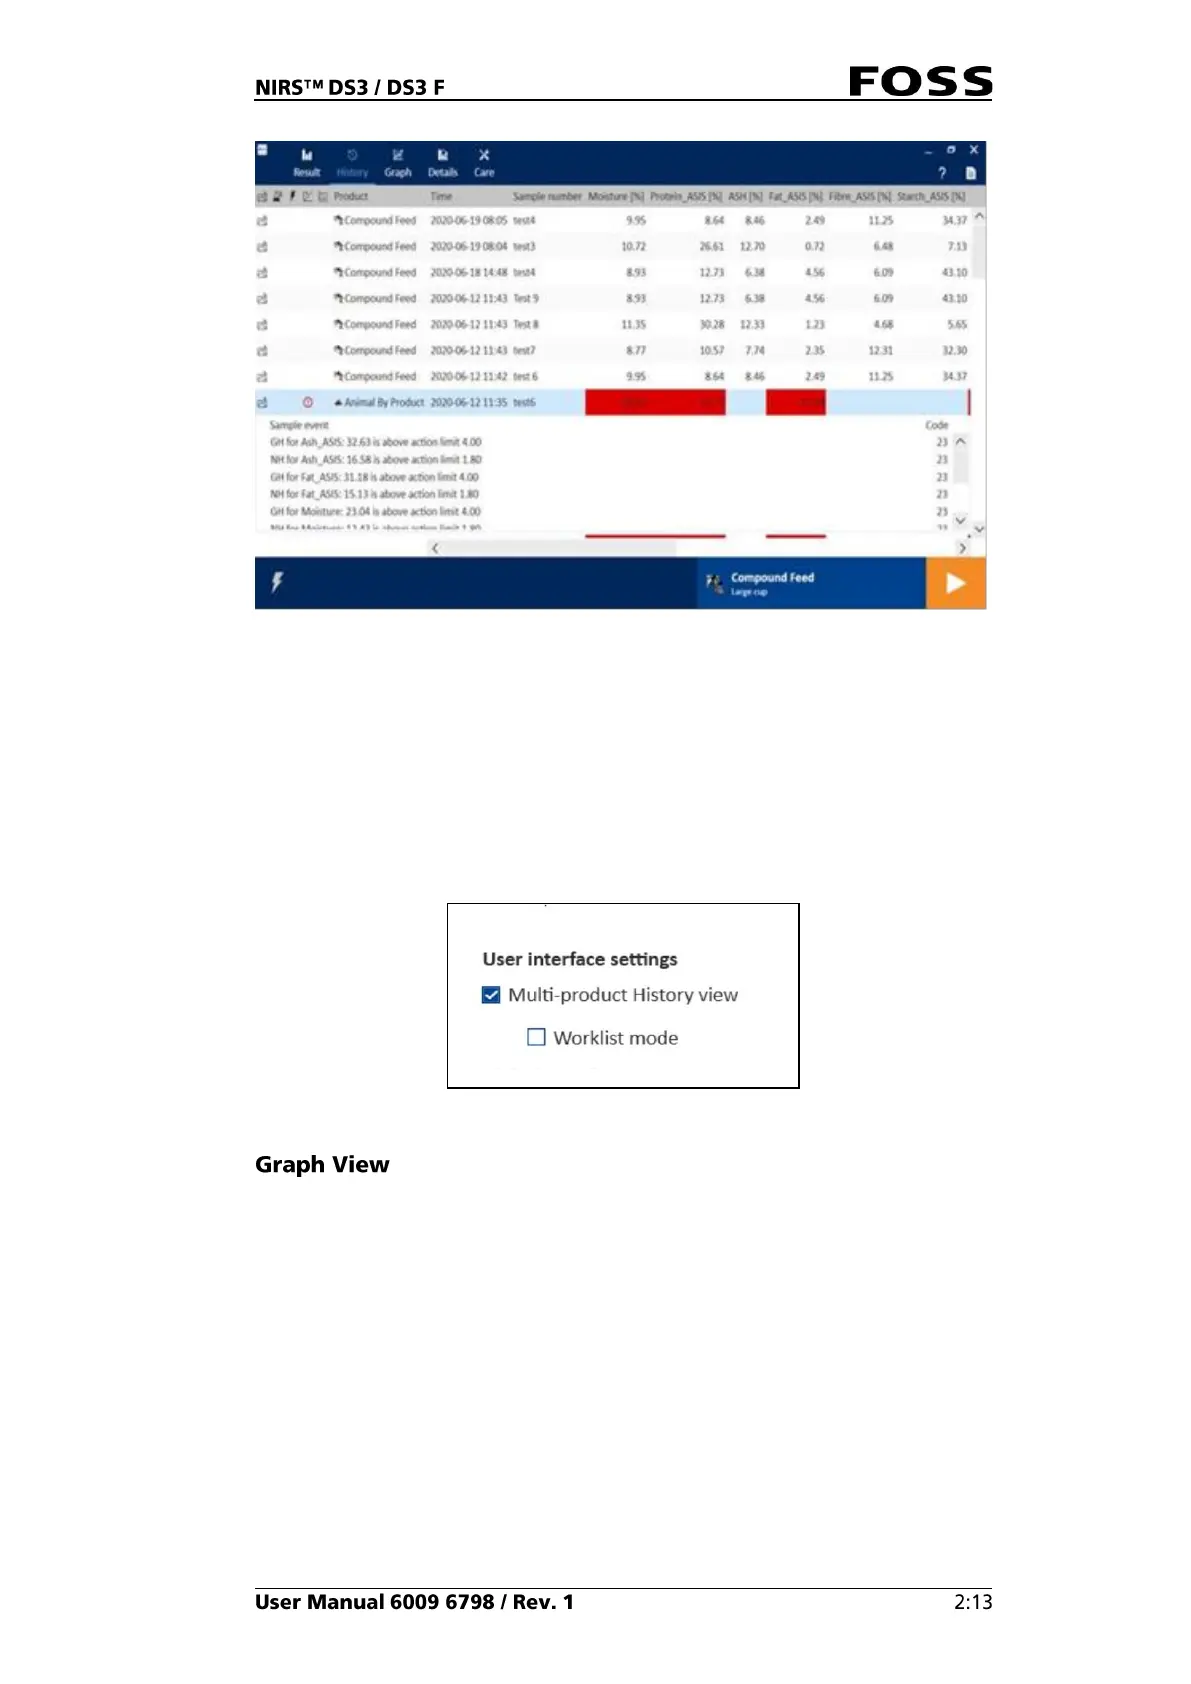
Fig. 19 History view
If product limits are used, a result exceeding a warning or action limit will be
displayed with either a yellow (warning) or red (action) background. If you click in
the coloured cell, the detailed view will open with information about the exceeded
limits.
If you click the product selector, you can select another product and get a History
view directly presented for that product.
There is also a Multi-product History view available. It will show all products
rather than only the selected one. It must be set up in the Care/Settings/Instrument.
Fig. 20
The Graph view (Fig. 21) gives a graphical presentation of the results for a
specific product. Target, warning and action limits for each parameter can be
defined in FossManager.