27
First Steps
The DISP/BACK Button
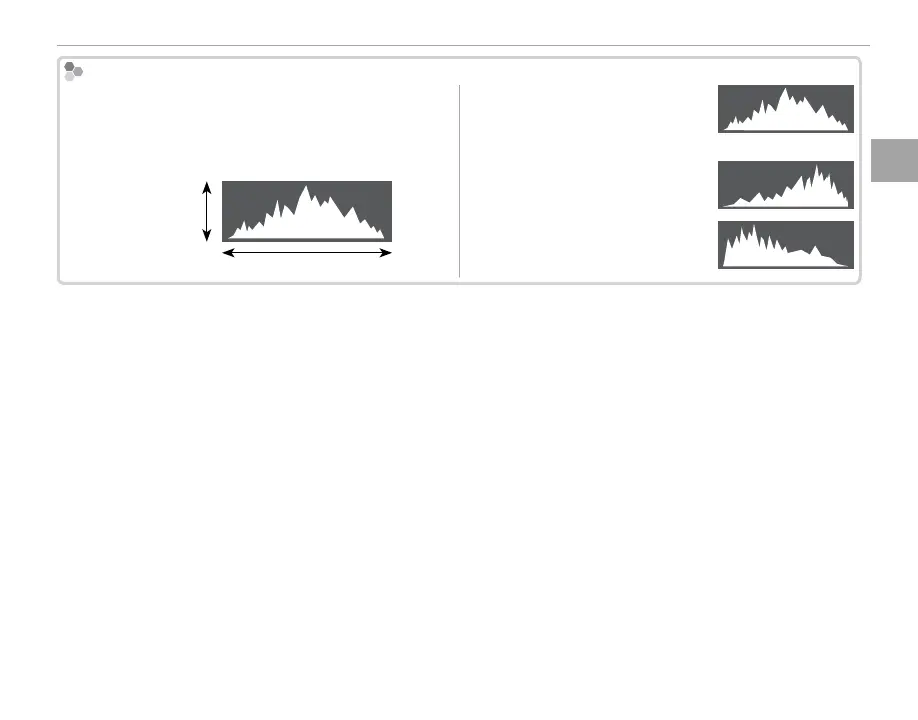
Histograms
Histograms show the distribution of tones in the im-
age. Brightness is shown by the horizontal axis, the
number of pixels by the vertical axis.
Shadows Highlights
No. of pixels
Pixel brightness
Optimal exposure: Pixels are distrib-
uted in an even curve through-
out the tone range.
Overexposed: Pixels are clustered
on the right side of the graph.
Underexposed: Pixels are clustered
on the left side of the graph.