Instrument Circuitry – Interface 1010 Schematic/Block Diagrams
52
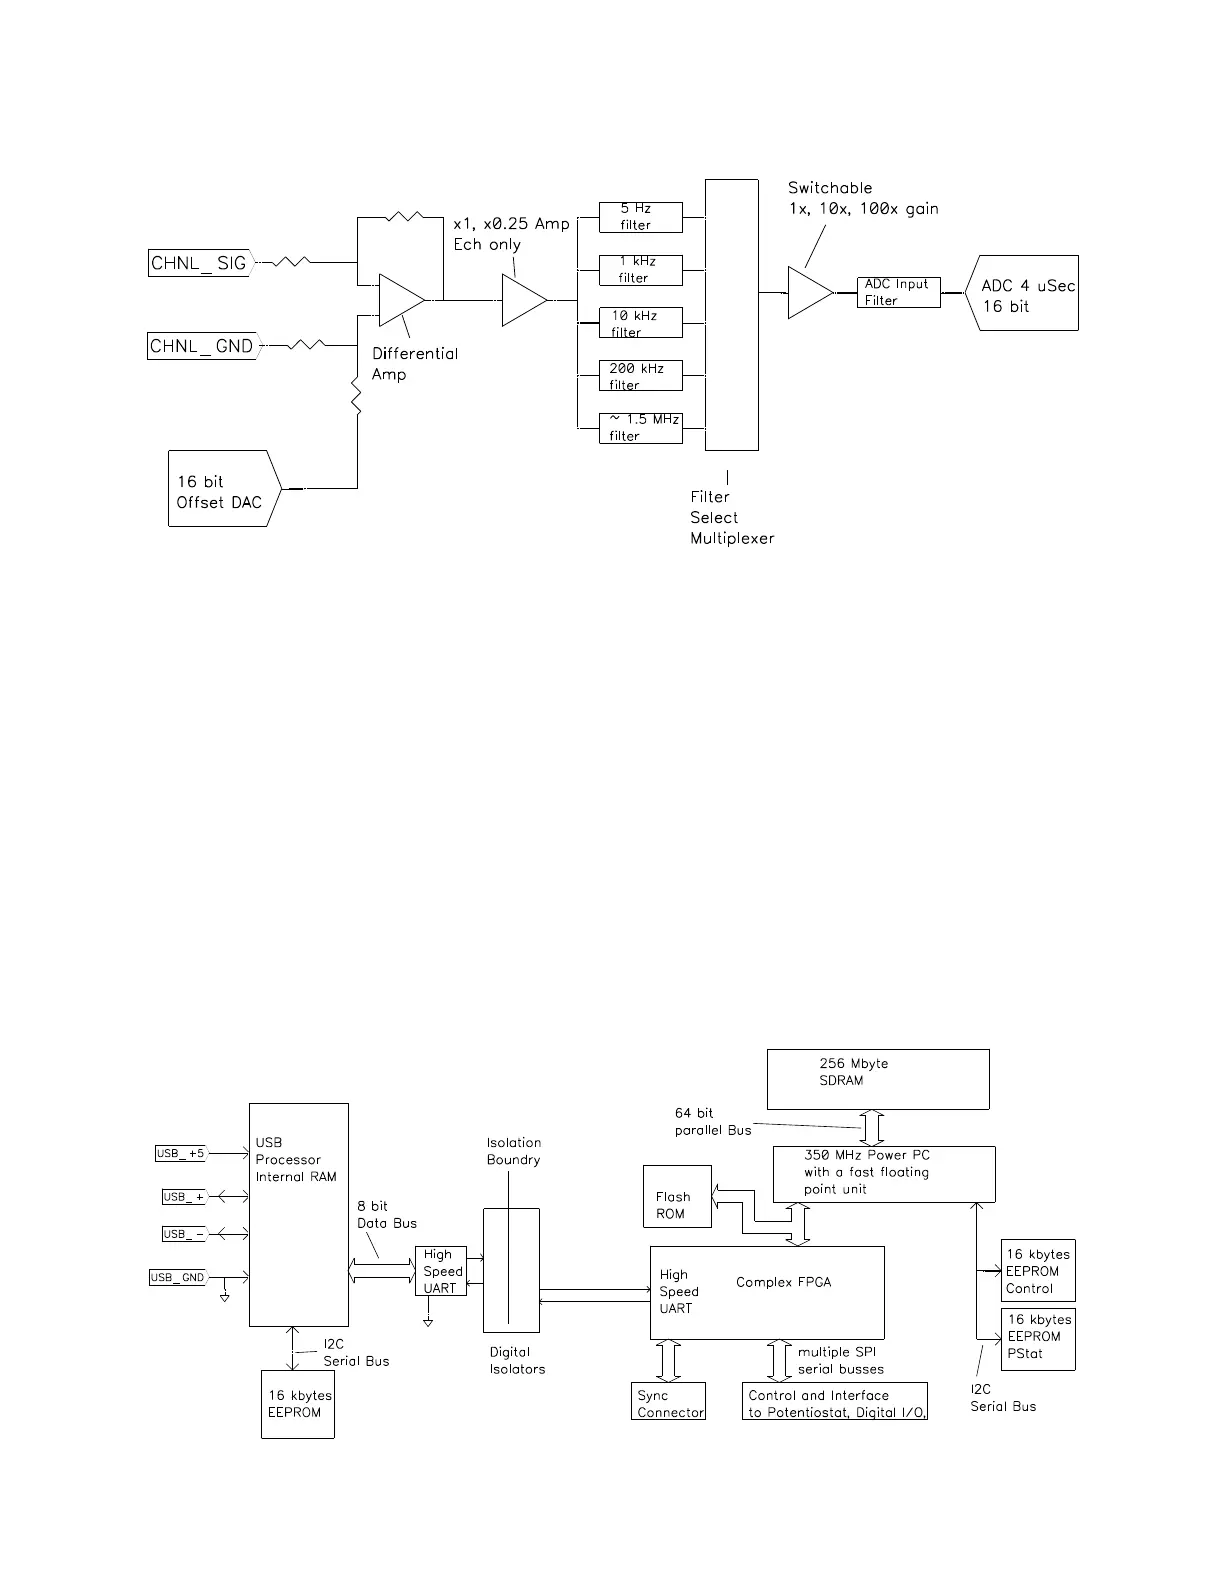
Figure 7-3
One A/D Signal Chain in the Interface 1010
Notes for Figure 7-3:
• This diagram shows one of two identical ADC channels. One channel is dedicated to measurement of
the potentiostat’s current signal and the other is used to measure the voltage signal.
• Both A/D converters are triggered simultaneously to start a conversion. This trigger and the pulse
updating the Scan DAC voltage are under the control of a hardware state-machine. This ensures that
all waveform and data-acquisition timing is tightly controlled and reproducible point-to-point.
By default, the data acquisition is synchronized with the system’s 600 kHz power-supply switching-
frequency reducing noise from the power supply. Data-acquisition times that are a multiple of 1.666
µs will maintain this synchronization.
• All analog signals are received differentially as shown here.
• The 5 Hz, 1 kHz, 10 kHz, 200 kHz and 1.4 MHz filters are two-pole Butterworth filters.
• The voltage-measurement channel includes a programmable 1×−0.25× gain circuit. In the 0.25 gain
position, voltages as high as 12 V can be measured.
Figure 7-4
Microprocessors in the Interface 1010