8-12 469 Motor Management Relay GE Power Management
8.3 USING 469PC 8 469 PC SOFTWARE
8
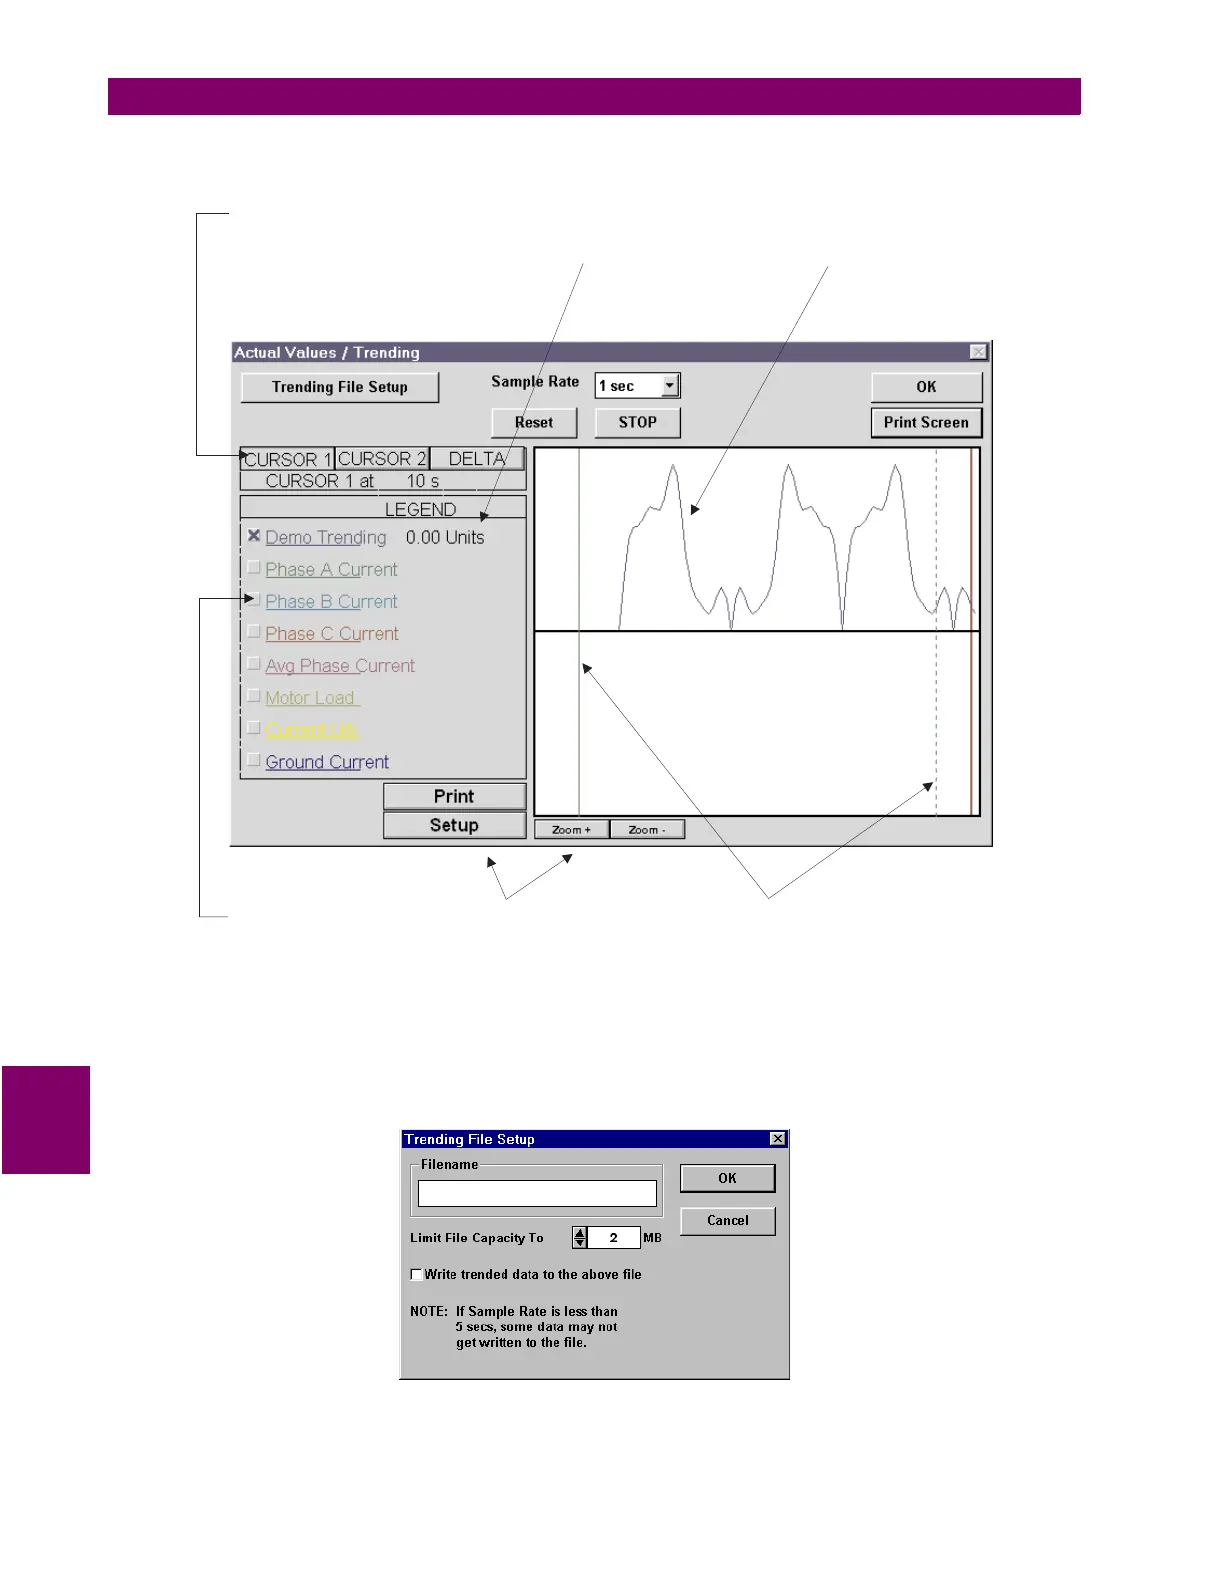
5. Select the
Sample Rate
through the pull-down menu, click the checkboxes of the graphs to be displayed,
and select
RUN
to begin the trending sampling.
Figure 8–7: TRENDING
6. The Trending File Setup button can be used to write graph data to a standard spreadsheet format. Ensure
that the
Write trended data to the above file
checkbox is checked and that the
Sample Rate
is a mini-
mum of 5 seconds.
Figure 8–8: TRENDING FILE SETUP
CHECK BOXES
Toggle the Check Box to
view the desired graphs.
BUTTONS
Print, Setup (to edit Graph Attributes)
Zoom In, Zoom Out
CURSOR LINES
To move lines, move mouse pointer
over the cursor line. Click and hold the
left mouse button and drag the cursor
line to the new location
MODE SELECT
Click on these buttons to view
Cursor Line 1, Cursor Line 2, or
Delta (difference) values for the graph
LEVEL
Displays the value of the graph
at the active Cursor Line
WAVEFORM
The trended data
from the 469 relay
 Loading...