QUICK REFERENCE GUIDE
469 MOTOR MANAGEMENT RELAY – QUICK REFERENCE GUIDE 37
7. Press “Run” to start the data logger. If the Log Samples to File item is selected, the
EnerVista 469 Setup software will begin collecting data at the selected sampling rate
and will display it on the screen. The data log will continue until the Stop button is
pressed or until the selected number of samples is reached, whichever occurs first.
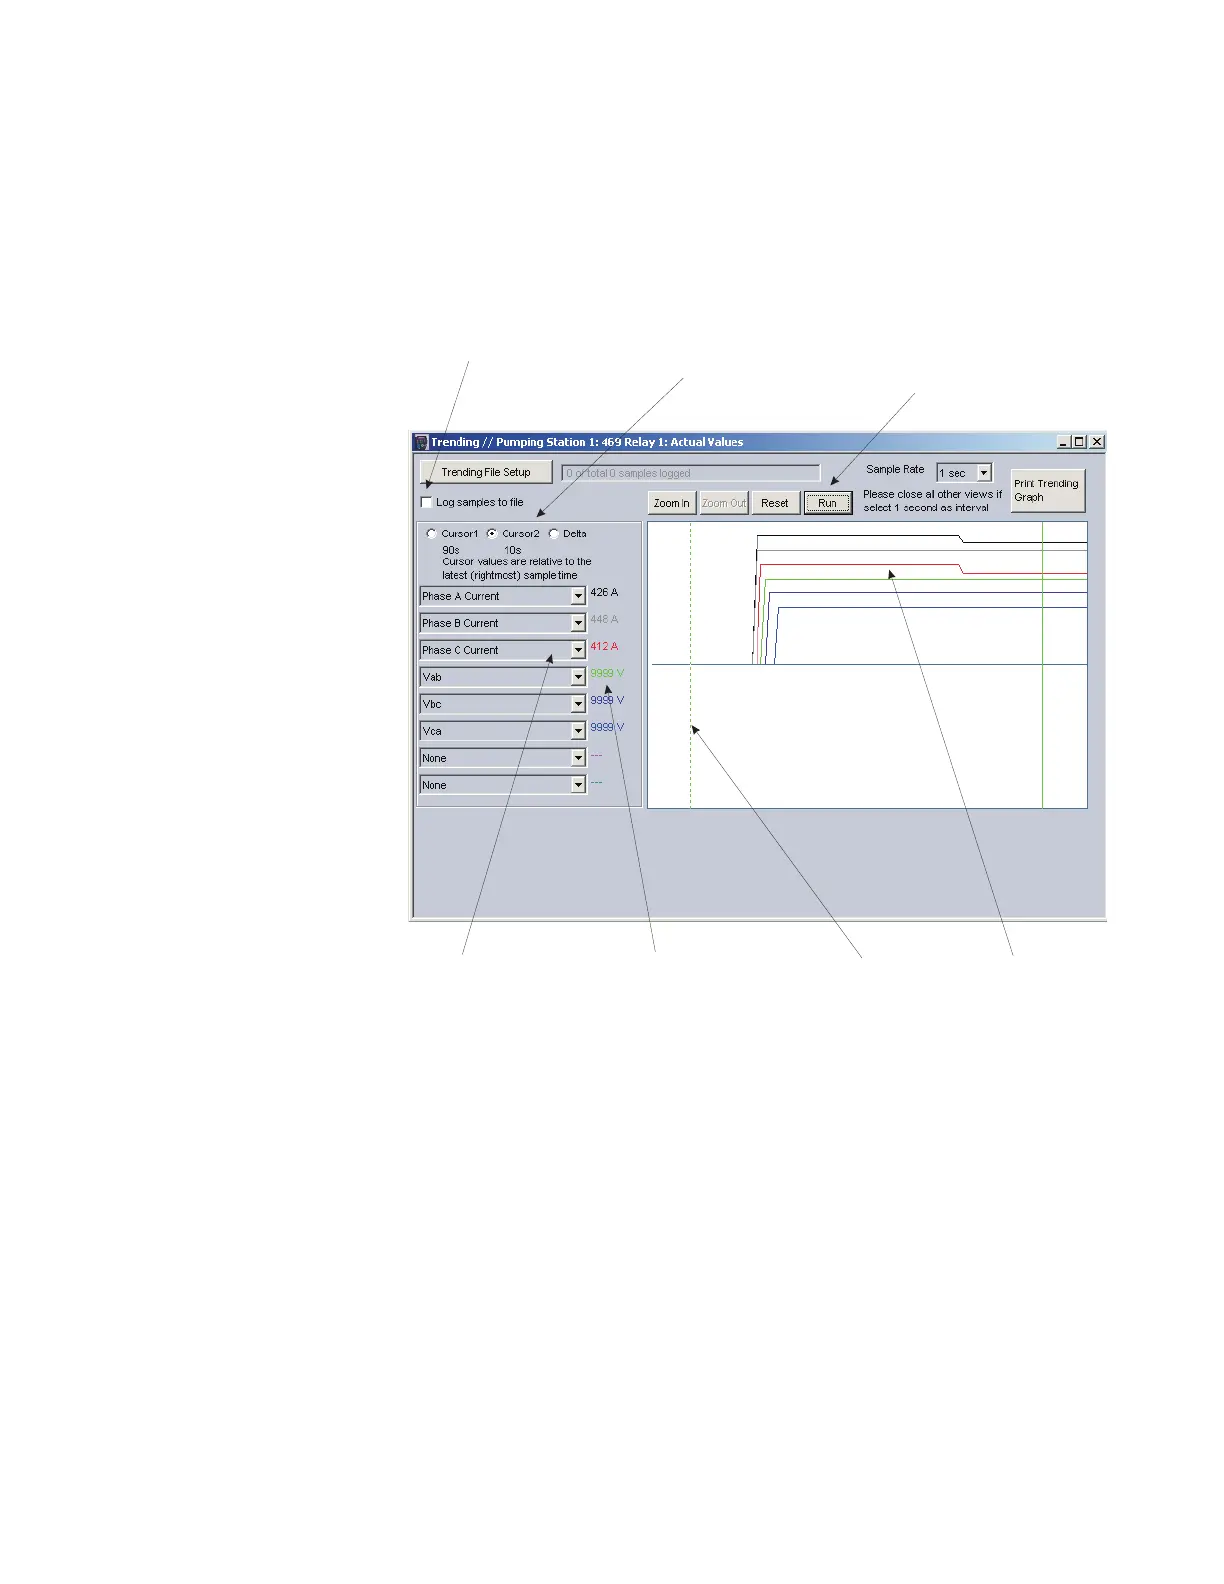
8. During the process of data logging, the trending screen appears as shown below.
FIGURE 16: Trending Screen
11.5 Event recorder
The 469 event recorder can be viewed through the EnerVista 469 Setup software. The
event recorder stores generator and system information each time an event occurs (e.g.
breaker failure). A maximum of 256 events can be stored, where E256 is the most recent
event and E01 is the oldest event. E01 is overwritten whenever a new event occurs. Refer
to the Event Record section in the instruction manual for additional information on the
event recorder.
Use the following procedure to view the event recorder with EnerVista 469 Setup:
SAVE DATA TO FILE
Select to save the
information to a CSV
file on the PC
MODE SELECT
Select to view Cursor 1,
Cursor 2, or the Delta
(difference) values for
the graph
BUTTONS
Zoom In enlarges the graph
Zoom Out shrinks the graph
Reset clears the screen
Run/Stop starts and stops
the data logger
GRAPH CHANNEL
Select the desired
channel to be captured
from the pull-down menu
LEVEL
Displays the value
at the active
cursor line
WAVEFORM
The trended data
from the 469 relay
CURSOR LINES
Click and drag the
cursor lines with
the left mouse
button