28
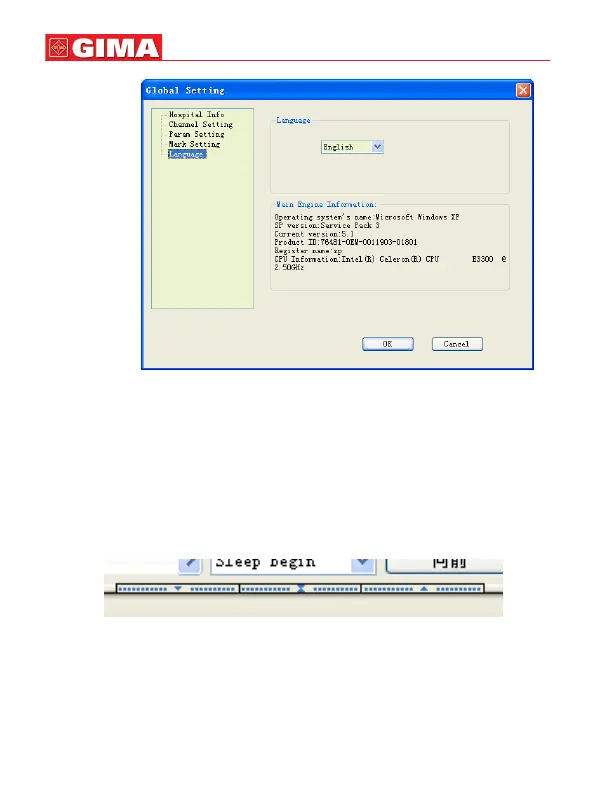
Figure 5-2-7
When clicking “OK” button in “Global Setting” dialogue box, the setup you have
done will be saved in system setting.
5.3 Waveform Display
The waveform display area is shown in Figure 5-1-3, the display area can display
two waveform charts, or one event chart and one waveform chart, or only event or
waveform chart. Window adjusting button can change the amount of charts and
size of the area, shown as Figure 5-3-1:
Figure 5-3-1
Four-lead data waveform for Flow, SpO2, Pulse, Pleth will be displayed in chart
display area, (as Figure 5-3-2). Drag the borderline of each waveform to change
the size of display area, which is convenient for observing. Some data marks
displayed in the front of each lead can use to conrm corresponding value, as
Figure 5-1-3(3):
ENGLISH