USER MANUAL For MULTISCAN plus
Chapter 4 - 8
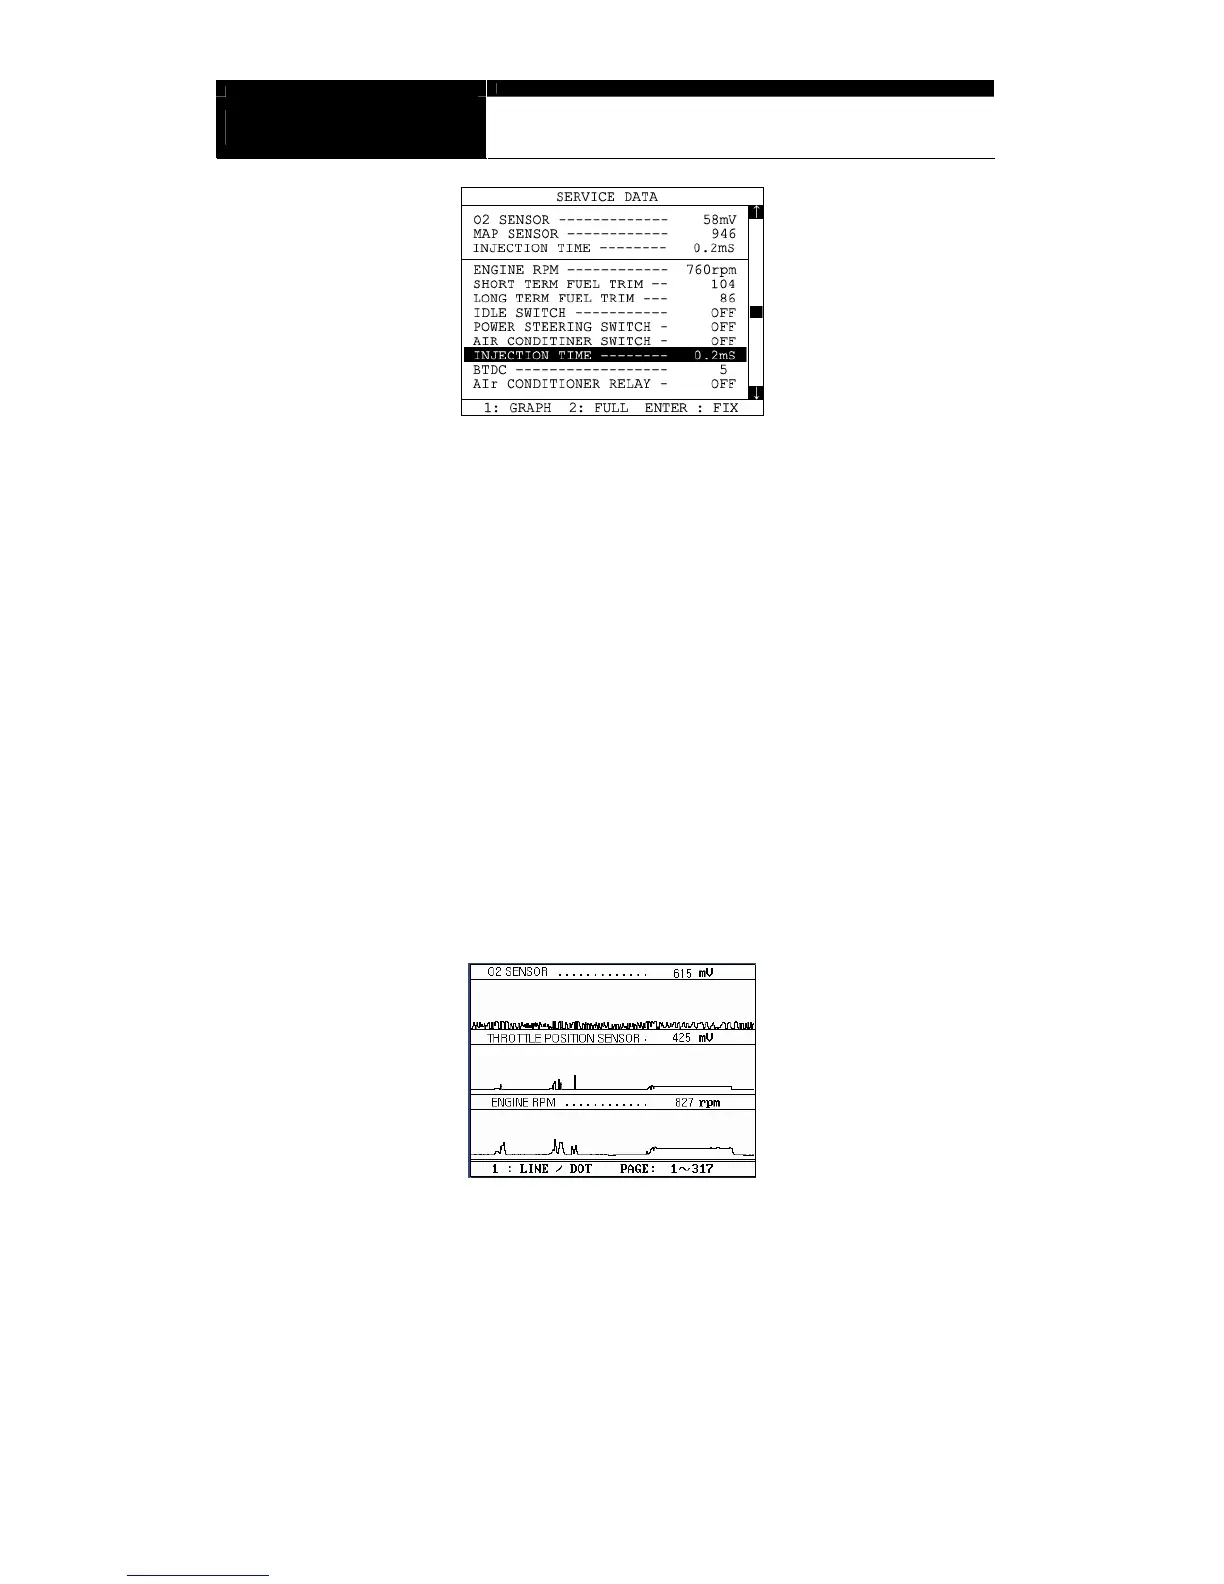
D. Data Graph
MULTISCAN plus provides the [Data Graph] function for more efficient
data analysis.
a When you press the [1] key after locating the highlight bar on the desired
sensor, the sensor data graph will be displayed as shown below.
b You can display up to 3 graphs in a screen by choosing the sensors as
previously explained [Data Freeze] procedure - Press the [Enter] key
after locating the highlight bar on the desired sensor, and then press the
[1] key. When more than 4 sensors are selected, the graphs of upper
three sensors will be displayed.