Hanatech Co., Ltd.
Chapter 4
Chapter 4 - 25
3. Graph
a As previously explained in section [3. Service Data], data from up to
three selected parameter data can be graphed.
b Make sure that the Black Box data replay is stopped. If it is being
replayed or paused, press the [NO] key to stop replaying completely.
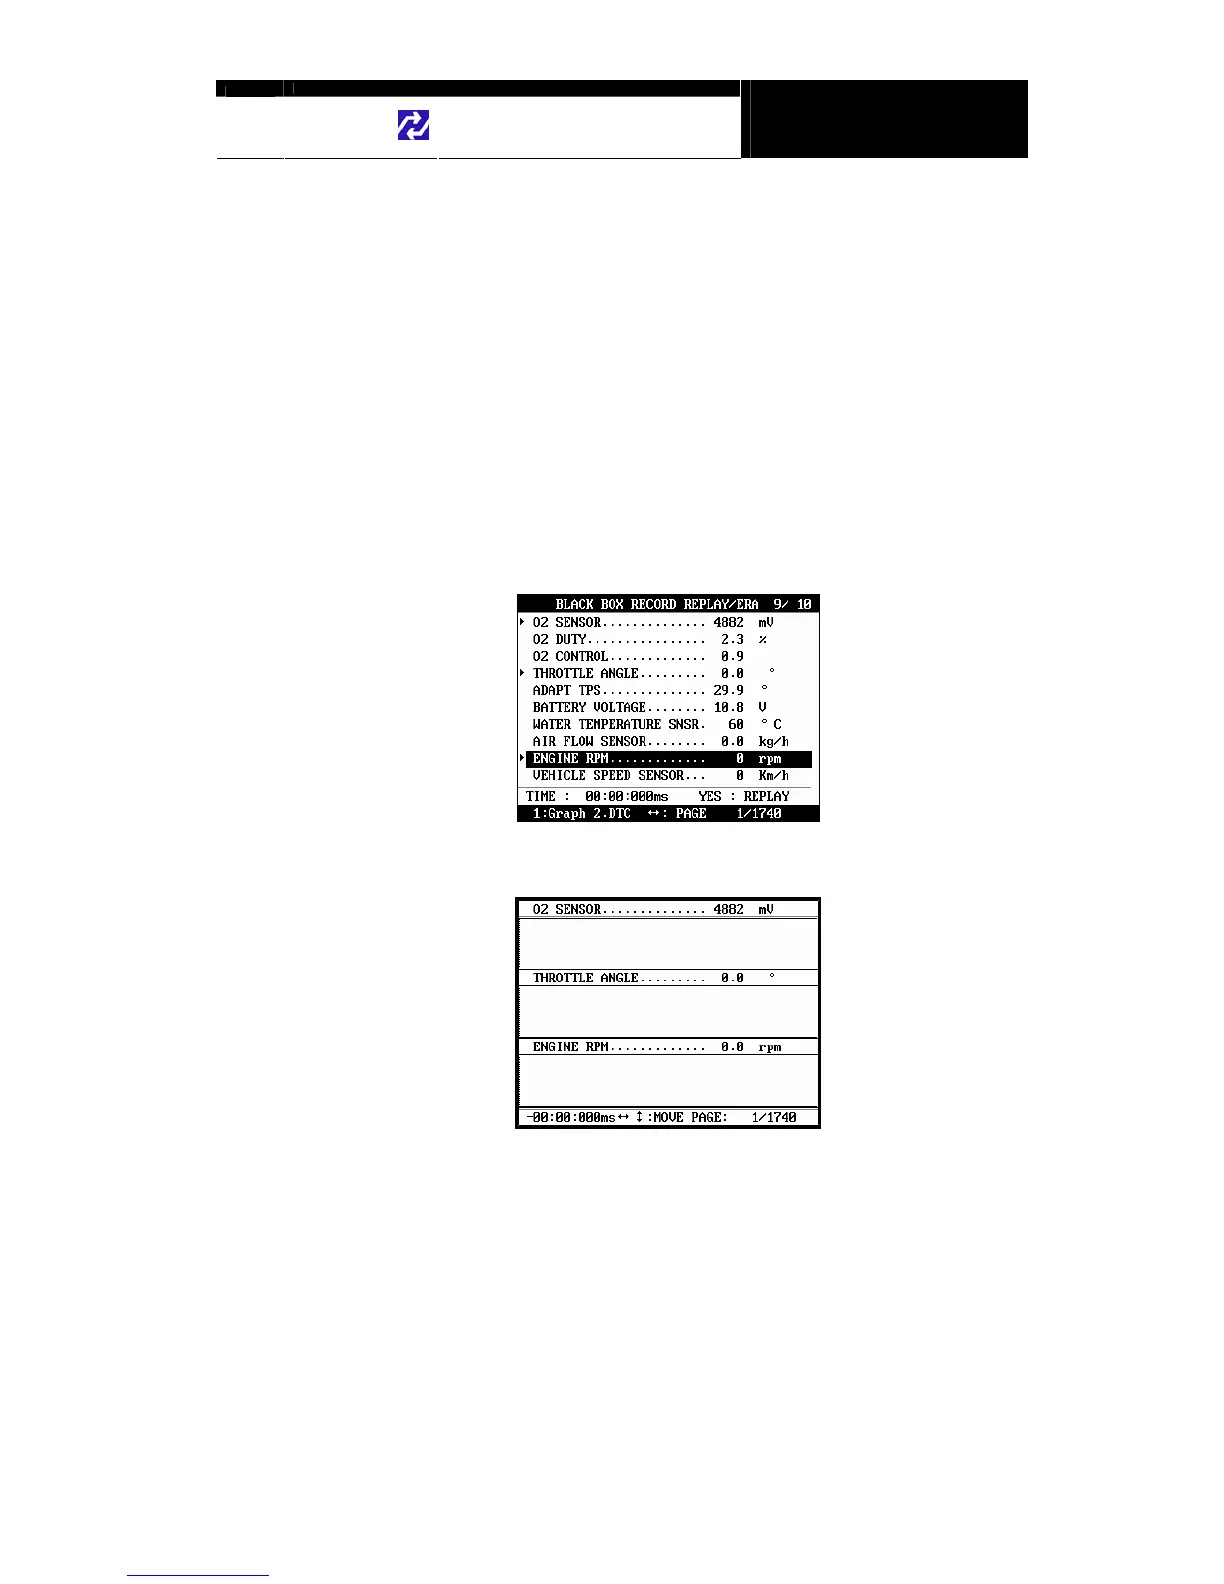
c Choose the parameter by locating the highlight bar and pressing the
[ENTER] key. The selected parameter will be marked with a triangle as
shown below:
d Then press the [1] key to view the data in graph format.
The line graphs are flat as it is not based on
data recorded from the active vehicle.