2.1.3. SPECTROPHOTOMETRIC TITRATIONS
The name comes from the method used to detect the endpoint of the titration, not its chemistry. Highly colored indicators that change
color during the course of the titration are available for many titrations. More accurate data on the titration curve can be obtained
if the light absorption is monitored instrumentally using a light source, a simple monochromator and a photodetector, rather than
visually determining the color or light absorption change. Light absorption by either an indicator or by one of the reactants or
products can be used to monitor the titration.
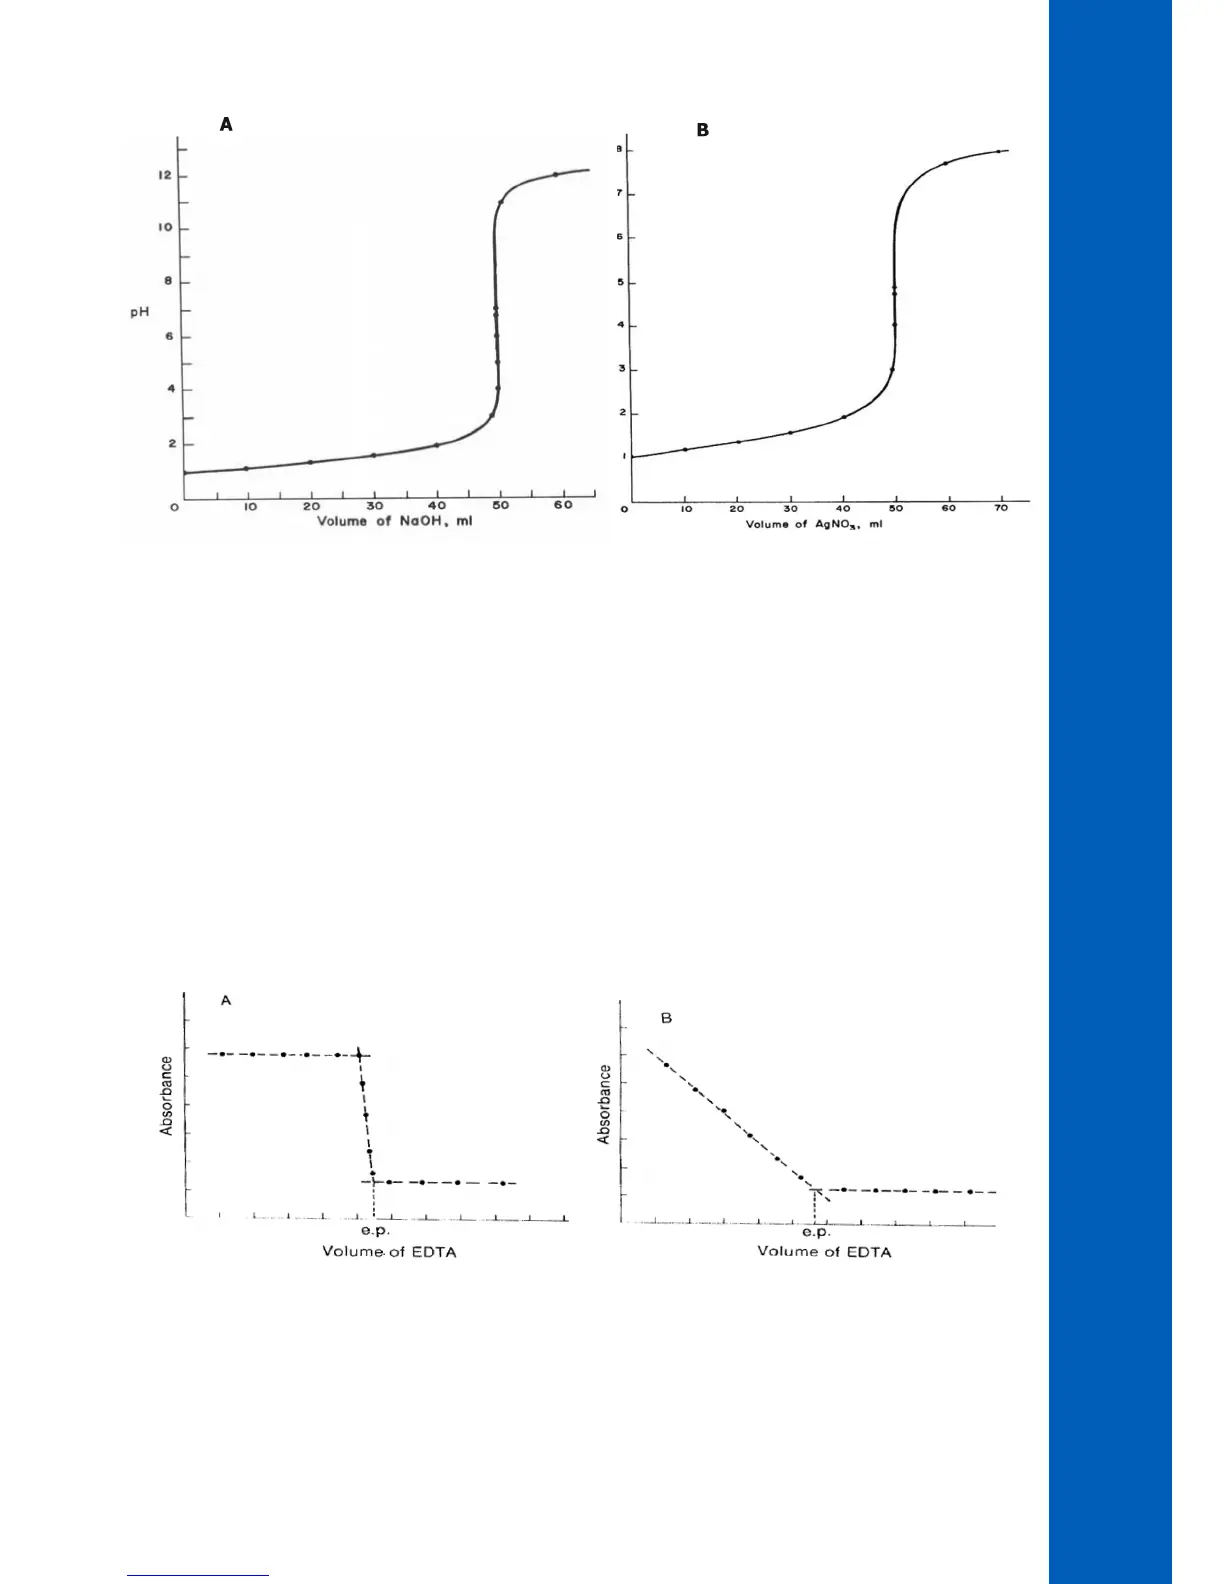
In the first titration curve, Figure 3 “A”, the absorption of a metal-indicator complex is being monitored. The absorption is constant
while the metal is complexed by the EDTA titrant. The metal indicator complex was stripped, causing a sharp break in the titration curve.
The point where all the metal is complexed and stripped from the indicator is the equivalence point. This point is marked by “e.p.” on the graph.
In the second titration curve, Figure 3 “B”, the metal complex is being measured while being titrated with EDTA. The new complex
being formed is not colored and does not absorb light. The extrapolated intersection of the two lines determines the equivalence
point.
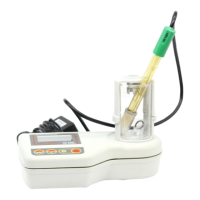
Figure 3
Figure 2
 Loading...