2.2. TITRATIONS ACCORDING TO THE REACTION TYPE
2.2.1. ACID-BASE TITRATIONS
Acid–base titrations are the most common type of titrations. They are based upon a reaction between an acid and a base, a
stoichiometric neutralization, or the exchange of protons. Virtually all acid-base titrations are carried out using a strong acid or a
strong base as the titrant. The endpoint of a titration carried out with a weak acid or a weak base would be difficult to detect due to a
small change in pH at the equivalence point.
Chemical indicators can be used to determine the endpoint. The indicator will change color to signify that the end of the titration
has been reached. The color of the indicator is dependent upon the concentration of ions in the solution. An acid-base indicator is
composed of a conjugate weak acid-weak base pair, where the two forms exhibit different colors depending on the pH of the solution.
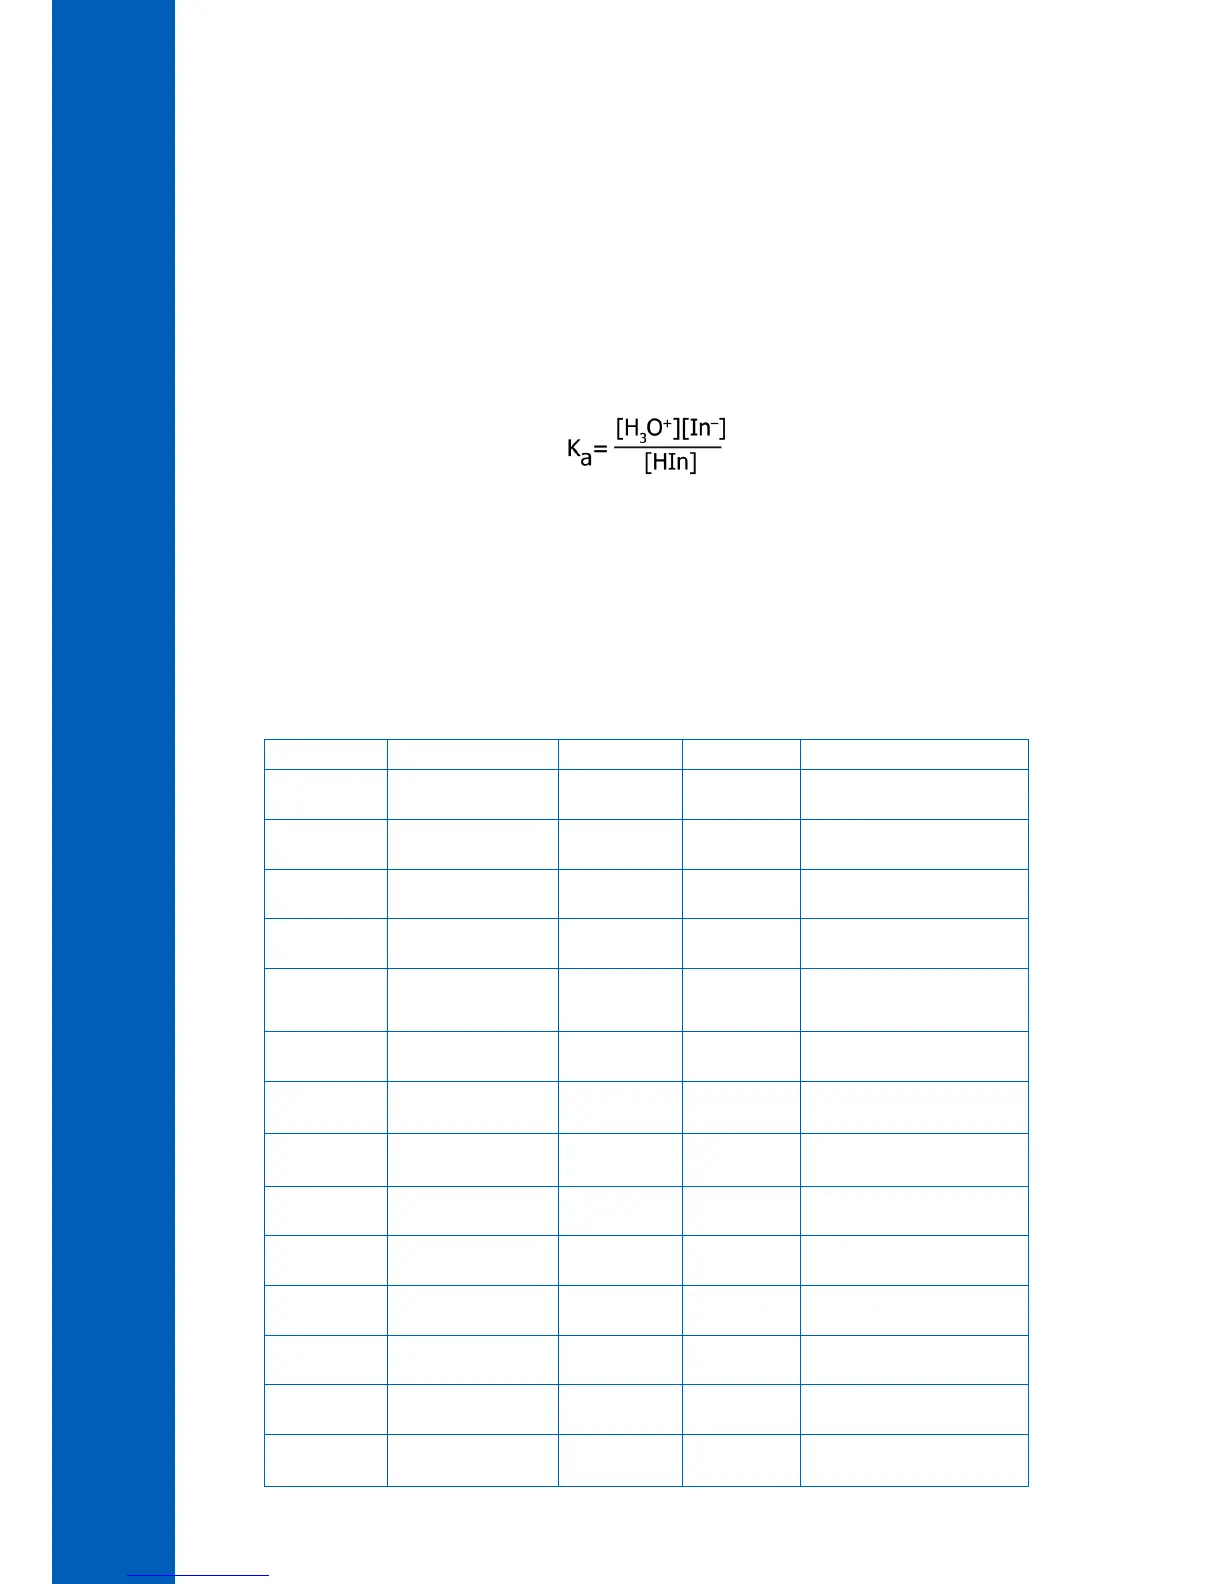
For an indicator, the acid ionization constant K
a
is usually written as:
HIn is the acid form of the indicator and In
–
is the base form. At the center of the change region, the ratio of [In
–
] to [HIn] is
one, [H
3
O
+
]=K
a
and pH=pK
a
. The color change region is usually ±1 pH unit around this point. Table 1 contains a list of some
aqueous acid-base chemical indicators, as well as the pH range, the pK
a
and the expected color (acid and base form). When choosing
the proper indicator you should select one that has a pK
a
as close to the endpoint of the titration.
When chemical indicators are not suitable, a potentiometric pH titration can also be used. The pH of the solution is plotted versus the
volume of titrant added. Figure 4 shows a traditional strong acid-strong base titration curve. The graph shows the volume of NaOH
added to an acidic solution and the resulting pH of the solution. Note the abrupt change in the pH at the equivalence point.
Table 1
pH Range Indicator pK
a
Acid Form Base Form
0.0 - 1.6 Methyl Violet Yellow Blue
1.2 - 2.8 Thymol Blue 1.65 Red Yellow
3.2 - 4.4 Methyl Orange 3.46 Red Yellow
3.8 - 5.4 Bromocresol Green 4.90 Yellow Blue
4.8 - 6.0 Methyl Red 5.00 Red Yellow
5.2 - 6.8 Chlorophenol Blue 6.25 Yellow Red
6.0 -7.6 Bromothymol Blue 7.30 Yellow Blue
6.6 - 8.0 Phenol Red 8.00 Yellow Red
7.4 -9.0 Metacresol Purple 8.30 Yellow Purple
8.0 - 9.6 Thymol Blue 9.20 Yellow Blue
8.2 - 10.0 Phenolphthalein 9.50 Clear Pink
9.4 -10.6 Thymolphthalein Clear Blue
10.1 - 12.0 Alizarin Yellow R Yellow Red
11.4 - 12.6 Indigo Carmine Blue Yellow
 Loading...