2 - 6
2.3 Description of Fluorometry
2.3.1 Principle of fluorometry
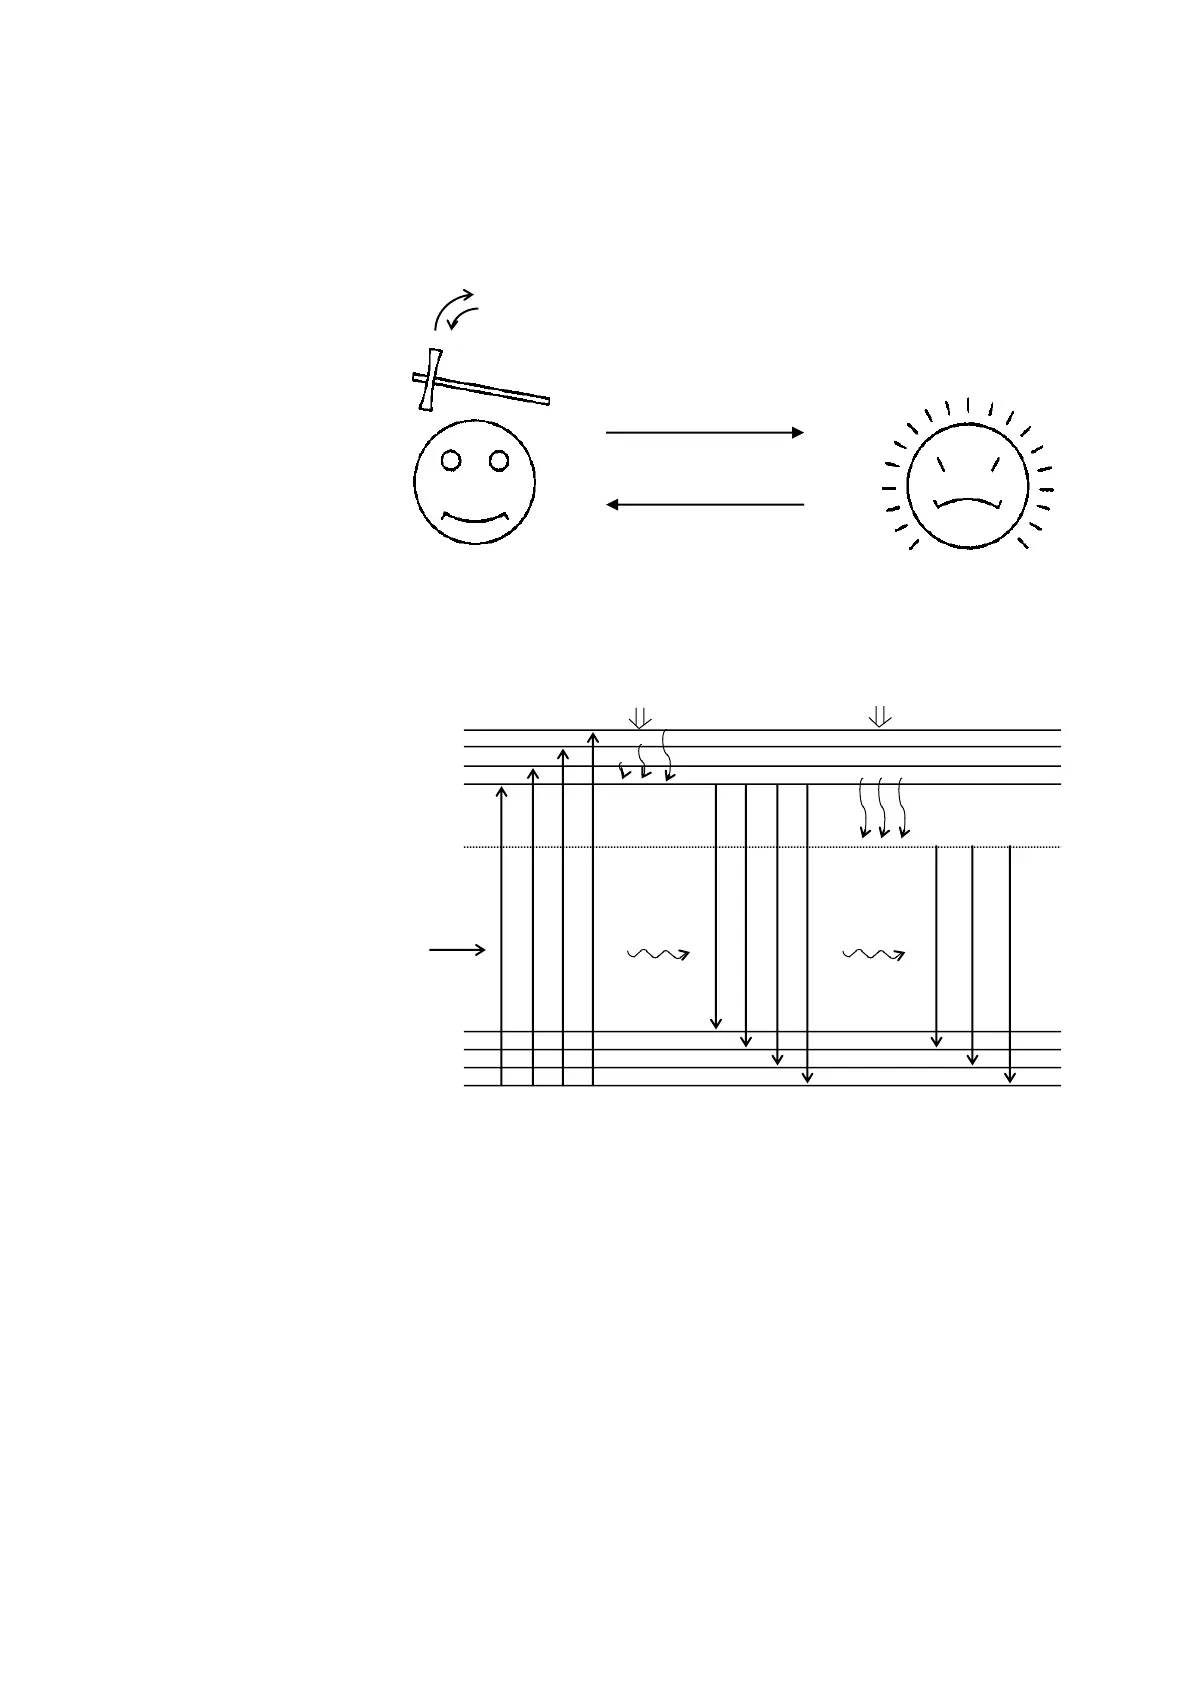
Fig. 2-4 Typical Organic Molecular Energy Level Diagram
Figure 3-4 shows the energy level transitions of an organic
molecule for the various processes involved in absorption,
fluorescence and phosphorescence.
 Loading...